Analysis of the "Flash Crash"
Date of Event: 20100506
Part 2-b, Previous Occurrences - NYSE Quotes
If the quotes sent from the NYSE were stuck in a queue for transmission
only to be time stamped when exiting the queue, then all data inconsistencies
disappear and things make sense. In fact, this very situation occurred on 2
separate occasions at October 30, 2009, and again on January 28, 2010
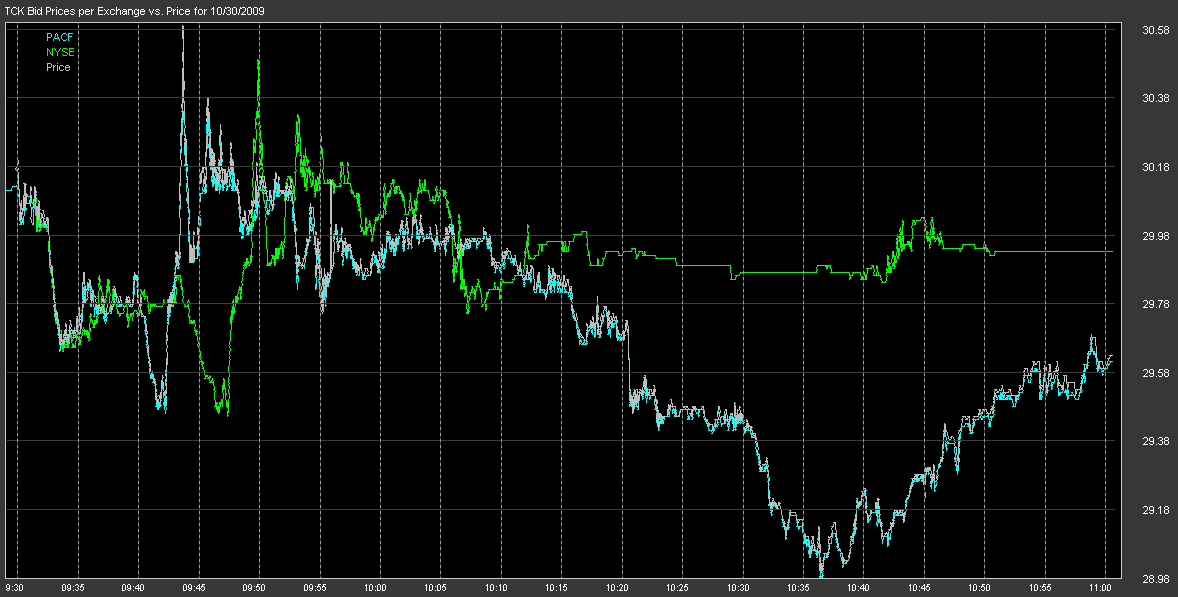
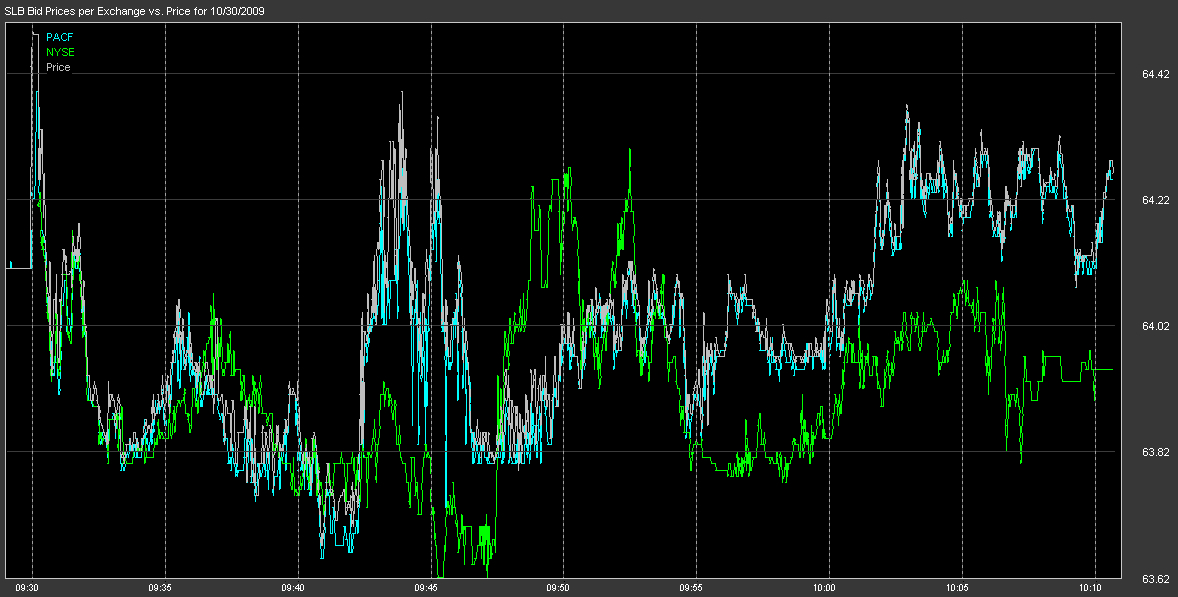
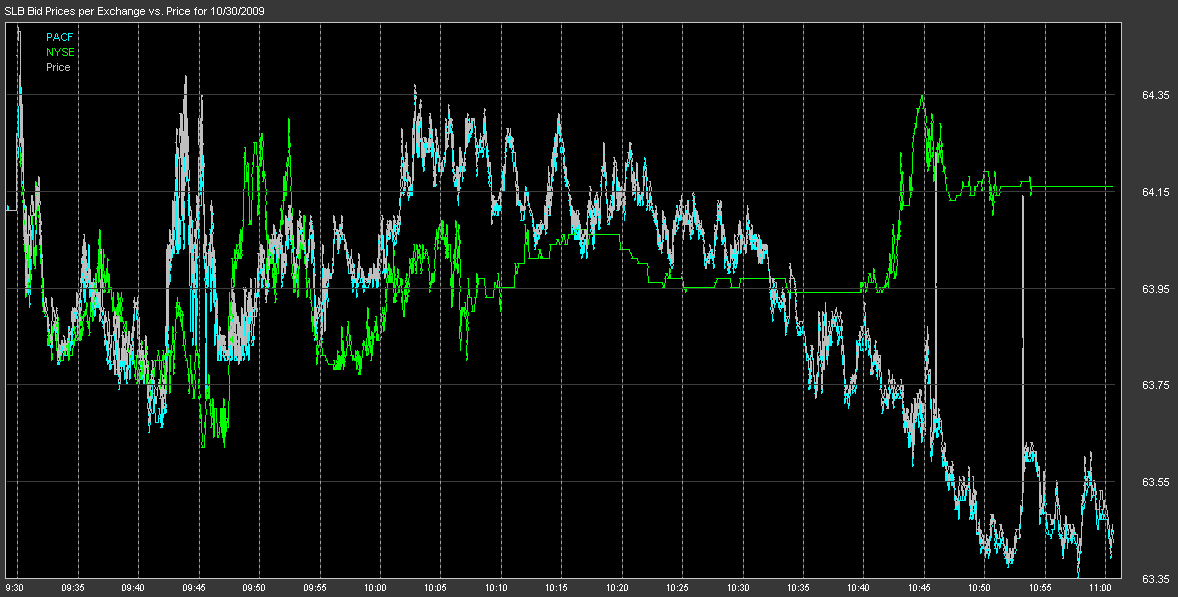
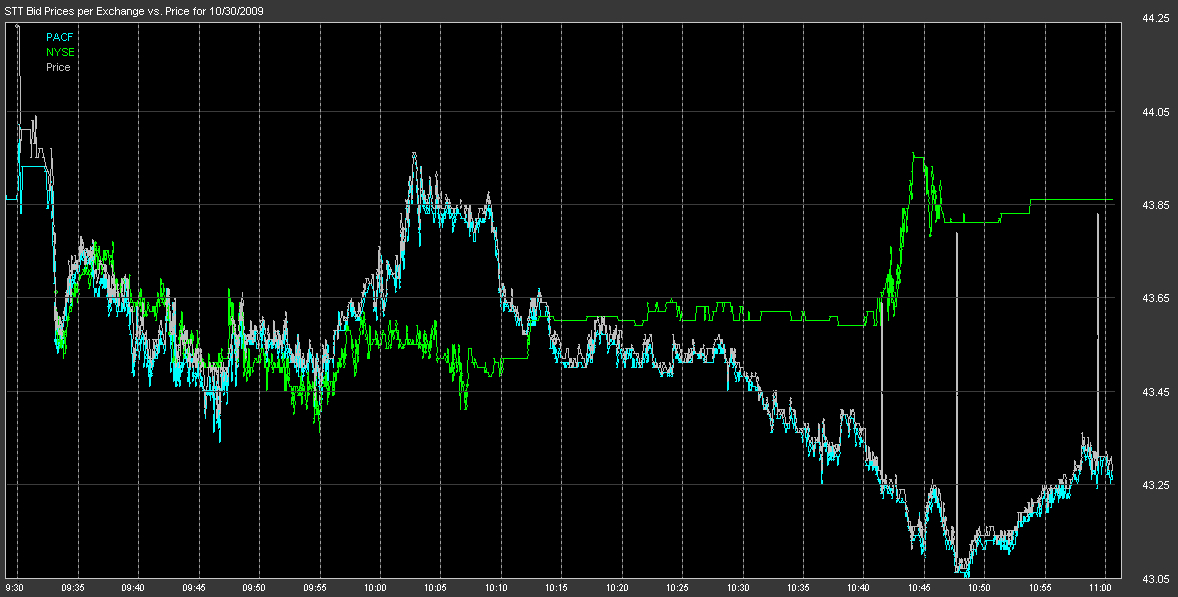
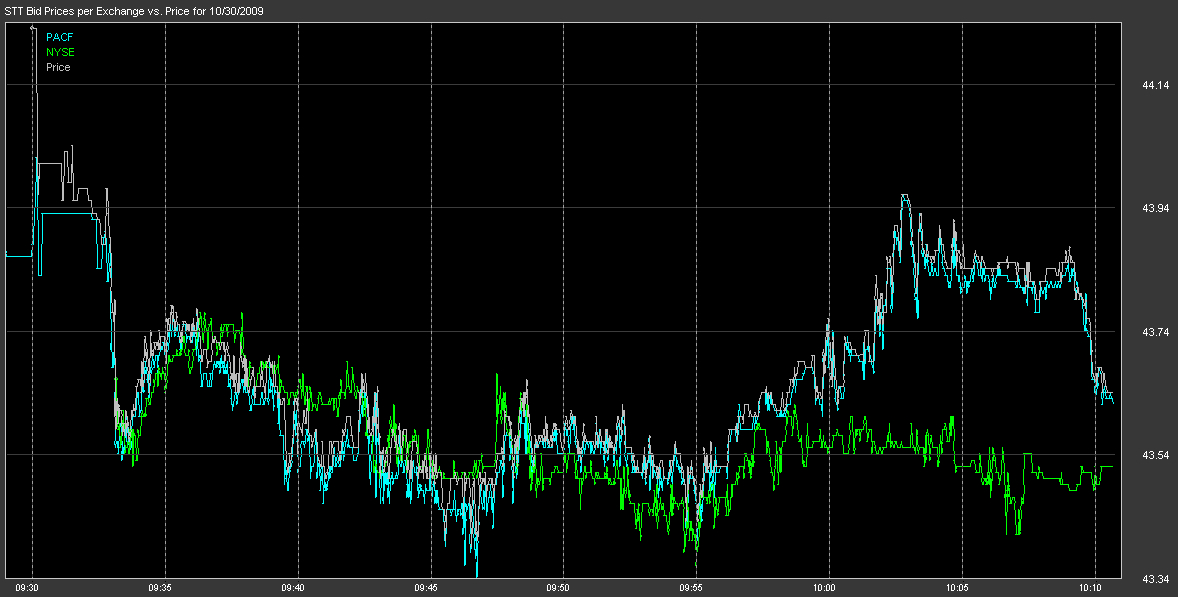
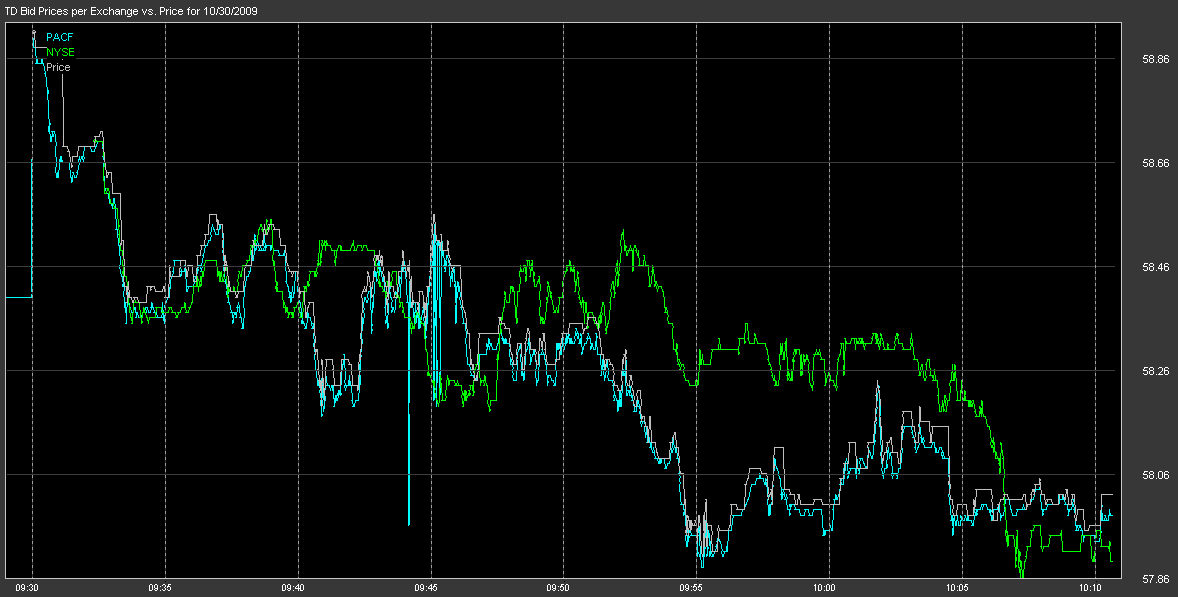
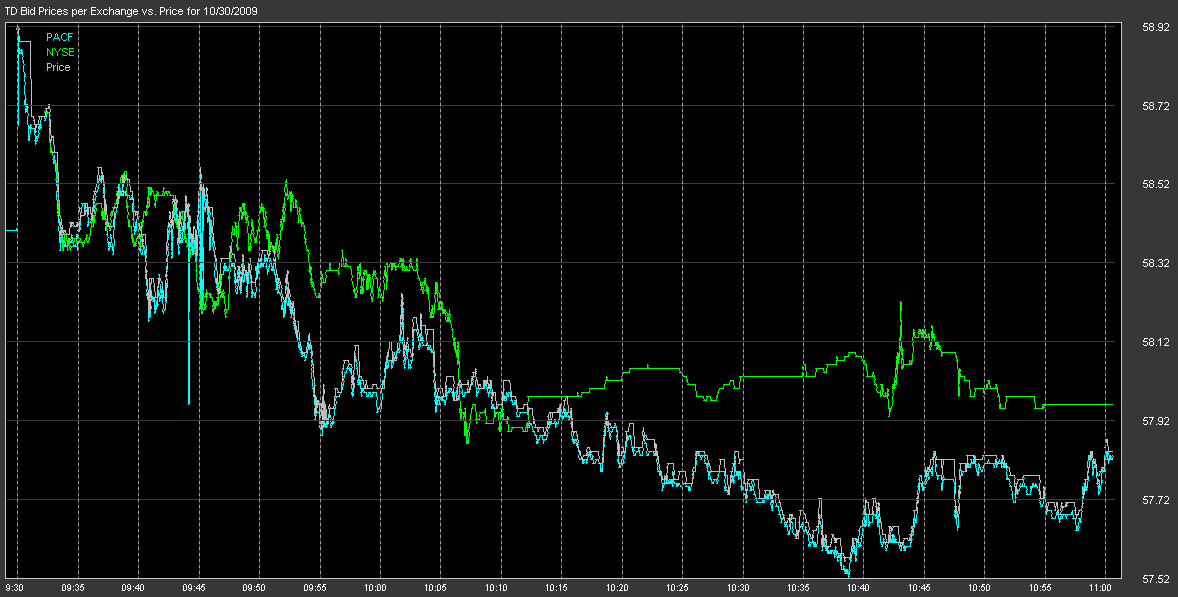
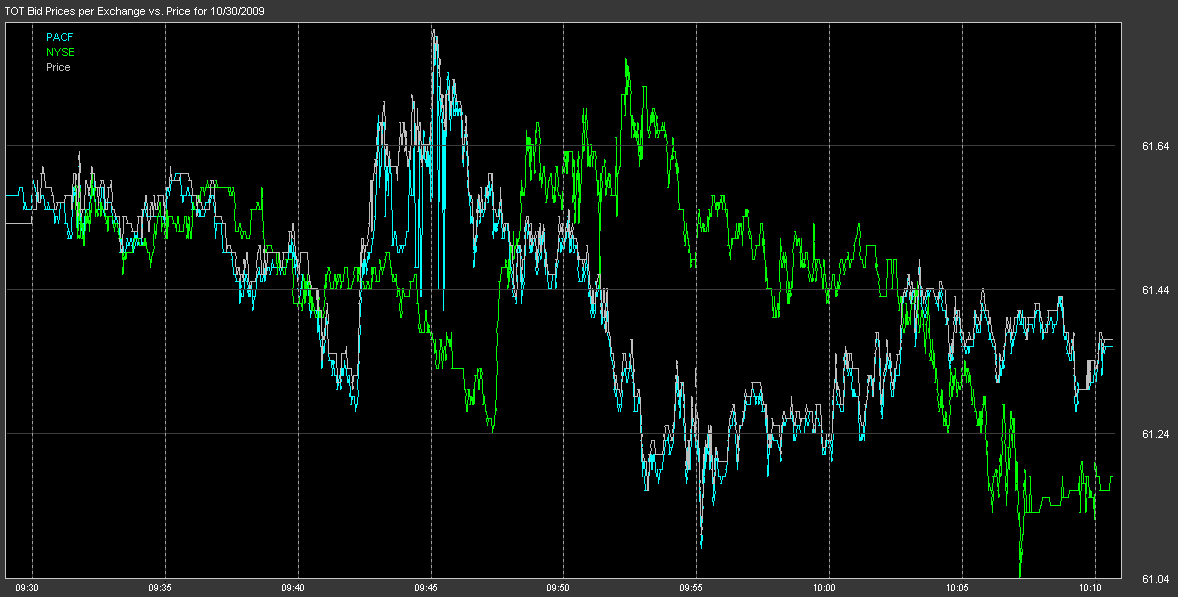
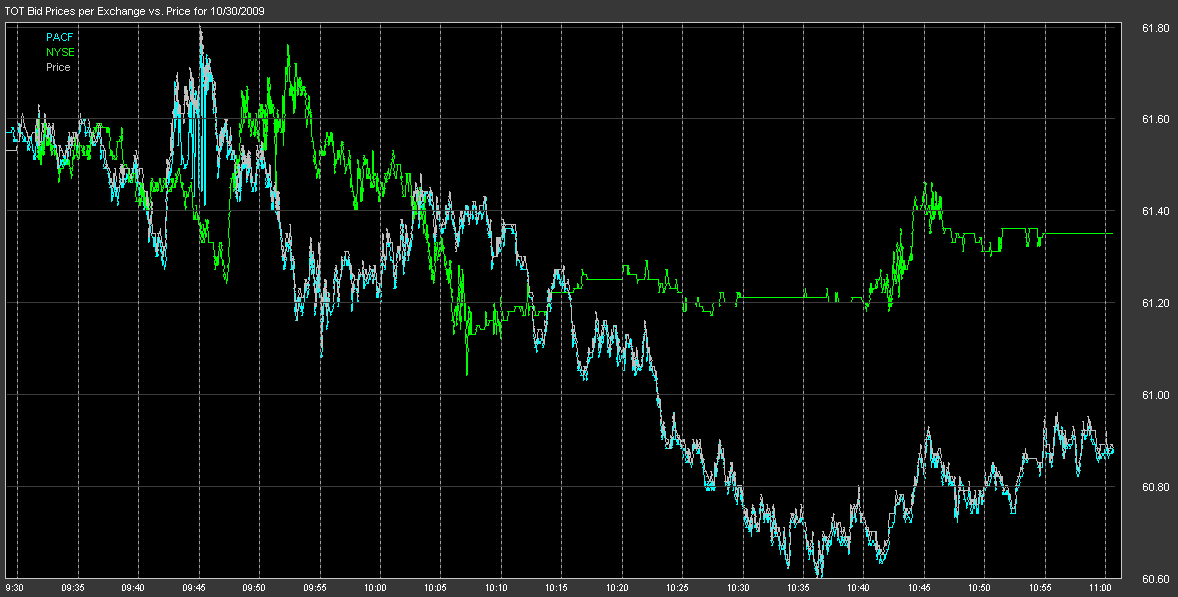
as shown below. Charting the bid/ask cross counts for those two days reveals the same pattern as 5/6! Looking at the details of the trade and quote data on those days shows the same time stamp/price inconsistencies. The NYSE stated that during the same intervals, they were experiencing delays in disseminating their quotes! In summary, quotes from NYSE began to queue, but because they were time stamped after exiting the queue, the delay was undetectable to systems processing those quotes. On 05/06/2010 the delay was enough to cause the NYSE bid to be just slightly higher than the lowest offer price from competing exchanges, but small enough that it was difficult to detect. This caused sell order flow to route to NYSE -- thus removing any buying power that existed on other exchanges. When these sell orders arrived at NYSE, the actual bid price was lower because new lower quotes were still waiting to exit a queue for dissemination. The following charts show individual stocks were the NYSE quotes were lagging noticably behind the market on 10/30/2009. This was a day were NYSE did make announcements that their quotes were running behind (see above). |
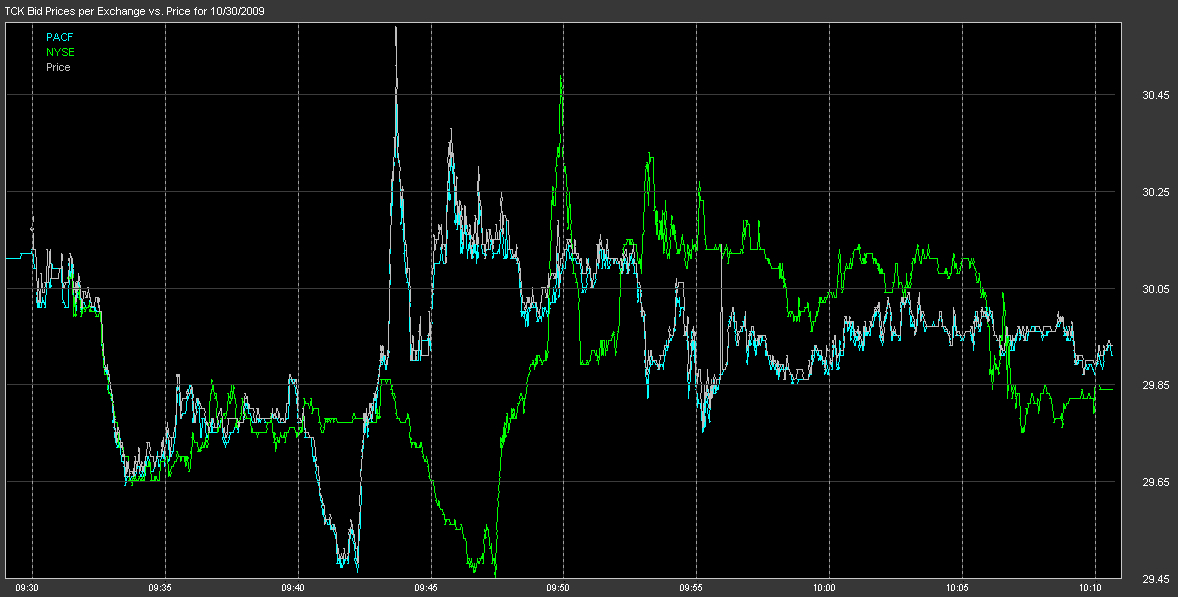
Take a quick look at the first chart for TCK. Note the low NYSE bid at
approx 9:47 which corresponds to the real price low at 9:42. If you simply
shift the entire NYSE bid plot back 5 min it overlays perfectly on the real
price/timeline. So, the NYSE Bids are approx. 5 minutes behind the market for
this stock yet they are time stamped at the current time! How can
this happen? There is only ONE possible explanation; NYSE quotes are
time stamped after exiting the queue, NOT when the quotes were actually
made. The remaining charts show the same quote behavior (quote lag time varies) and have been randomly selected from a long list of potential candidates. |
Take a look at STT. Note the NYSE bid rise from 10:42 - 10:45. That rise actually belongs to the real price rise occurring at 10:00 - 10:03. The NYSE Bids are approx. 40 minutes behind the market and again they are time stamped at the current time. |
The TD chart shows NYSE about 15 min behind. Take a look at the low NYSE bid at approx 10:07 which corresponds to the real price low at 9:55. If you simply shift the entire NYSE bid plot back 15 min it overlays perfectly on the real price/timeline. |
This report and all material shown on this website is published by Nanex, LLC and may not be reproduced, disseminated, or distributed, in part or in whole, by any means, outside of the recipient's organization without express written authorization from Nanex. It is a violation of federal copyright law to reproduce all or part of this publication or its contents by any means. This material does not constitute a solicitation for the purchase or sale of any securities or investments. The opinions expressed herein are based on publicly available information and are considered reliable. However, Nanex makes NO WARRANTIES OR REPRESENTATIONS OF ANY SORT with respect to this report. Any person using this material does so solely at their own risk and Nanex and/or its employees shall be under no liability whatsoever in any respect thereof. |