JTOOLS EXG LAG MONITOR APPLICATION
JTools Table of Contents
Project Location: \JTools_EXGLagMonitor
With the introduction of NxCore Version 3.0 in Q2 of 2016, the new (exchange
required) extended timestamps are passed through on all US Equities.
These timestamps offer microsecond resolution. The Exchange Lag Monitors tracks
two of these new timestamps:
- SRC - The time that the message was disseminated by the SIP (or
consolidated feed).
- PTP1 - The time that the message was disseminated at the Exchange.
NOTE: The extended timestamps are only available in tapes that end
with the .nx3 file extension. As of 08/17/2016 these tapes are only available
historically.
With the new participant 1 timestamp, the lag time that the message took to get
from the exchange to the SIP can now be determined with microsecond accuracy.
By using these new timestamps, trades can now be more accurately tracked to the
orders they executed on. Another useful purpose is determining the lag time it
takes for each message to go from the exchange to the SIP, which can also lead
to detection of problems at a specific exchange.
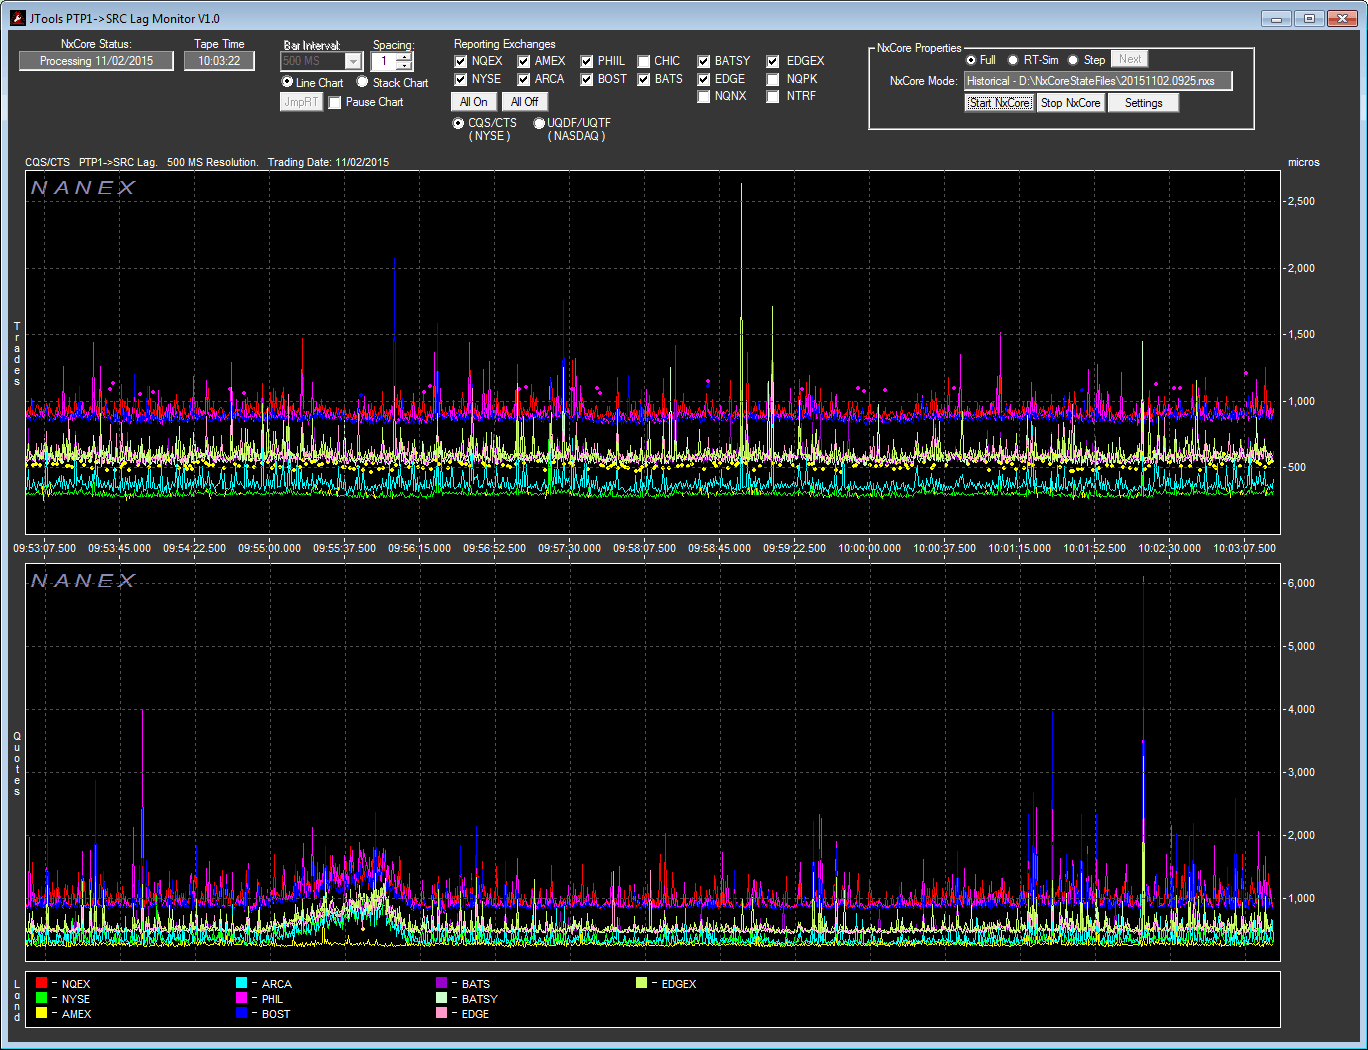
The exchange Lag Monitor Application is a very simple charting application that
measures, averages and plots the lag time of trade and quote messages to go
from the exchange to the SIP:

 |
Reporting Exchanges / SIPS:
All reporting exchanges (for US Equities) can be enabled or disabled in the
charts by checking on or off the specific exchange. You may turn all exchanges
on or off with a single click by pressing the "All On" or "All
Off" buttons.
Stocks that are listed on the NYSE are processed by CQS/CTS while stocks that
are listed on NASDAQ are processed through UQDF/UQTF. You may choose which SIP
to display stats charts by choosing the appropriate Radio button. |
 |
Chart Spacing and Elements:
- Bar Interval- The amount of time each interval on the chart
represents. This may be 1 second, 500 milliseconds, 250 milliseconds, 200
milliseconds, 100 milliseconds and 50 milliseconds. The bar interval can only
be chosen when the application is not processing a tape (IE prior to
starting).
- Spacing- Amount of pixels one bar will contain in width (x axis).
- Line Chart - Exchange plots are drawn as lines connecting one point
to the next.
- Stack Chart - Exchanges are sorted (by elapsed time) and plotted one
on top of another for each interval.
- Pause Chart - Will pause chart plotting while still collecting
data.
- JmpRT - If the chart has been scrolled back in time, JmpRT will be
enabled and pressing it will cause the chart to jump forward to the most recent
time..
|
|
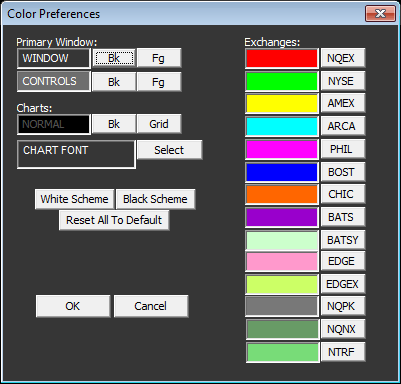
Colors and Additional Settings:
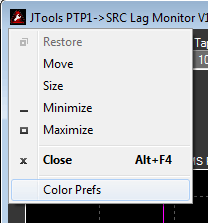
You may change colors for he entire application by clicking on the application
icon in the upper left corner, and choosing 'Color Prefs / Settings':


JTools Table of Contents
|