JTOOLS QTSEQUENCER APPLICATION
JTools Table of Contents
Project Location: \JTools_QTSequencer
During our
initial
investigation of the Flash Crash of May 6'th, 2010, we came across what
appeared to be very unusual bursts of quote traffic. On close examination these
bursts appeared to have patterns contained in the data. However, because many
of the patterns occurred within one second (or even milliseconds), the question
arose of how to visualize them. One of the many tools I developed was the
Quote-Trade sequencer, an application that charts every quote and trade
sequentially with no data loss or compression.
For a detailed explanation of how these charts work,
Please Read This Tutorial.
This application has been refined and revised many times since we began our
research. Like the One Sec Exg Plotter, the original GUI was a monster with
dozens of switches and toggles for items rarely used. Although this GUI may
seem a bit daunting, I have reduced it to what I consider reasonable while
still possessing nearly all of the original functionality. Many new items have
also been added (such as the stack size display) and much of the original
functionality has been automated.
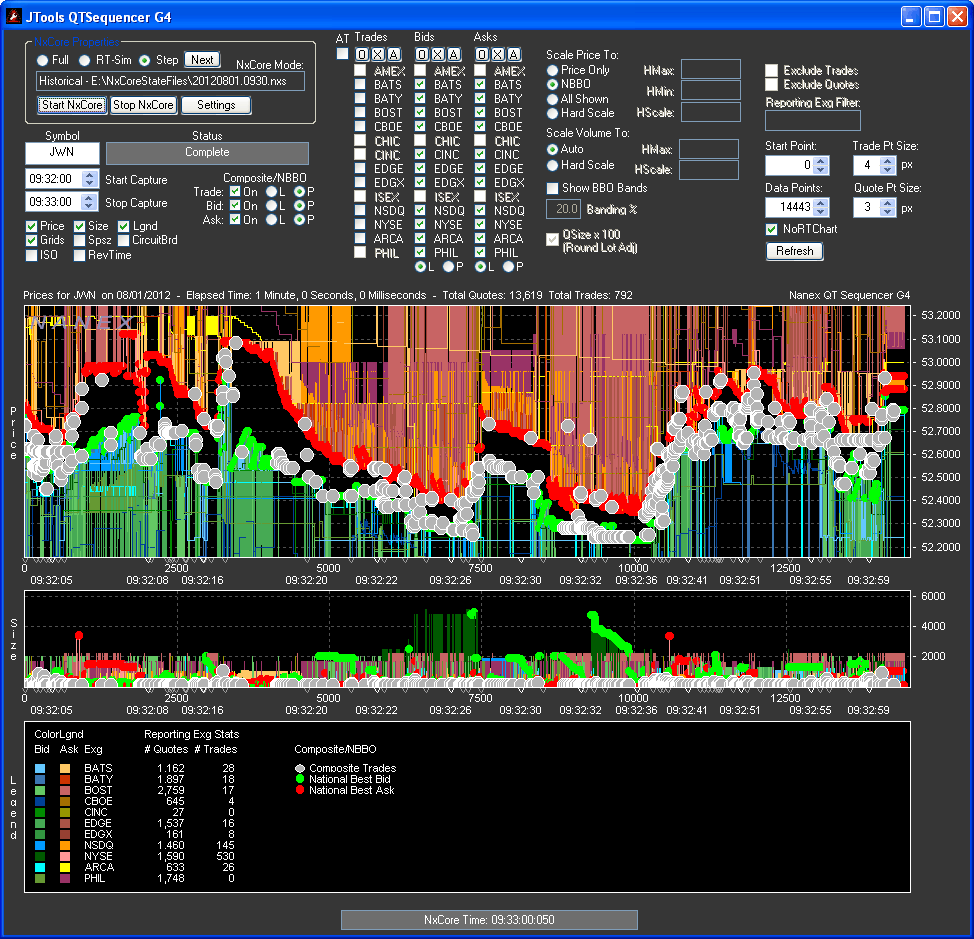
Show below is the QTSequencer, G4:
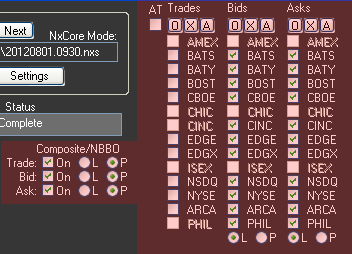 |
Composite and Exchange Quotes:
As the program is run, exchanges that are quoting/trading the issue will
automatically be enabled and checked for display. The legend will also
automatically grow and shrink with the current data.
"AT" - If checked, then exchange specific trades will
automatically be charted in the sequence. If unchecked then composite trades
will automatically be charted in the sequence.
"O" - Turns all items available for charting on and refreshes
the chart.
"X" - Turns all items in the set off and removes them from the
chart and legend.
"A" - Recalculates available items based on what is shown in
the display. As you zoom in and out of a chart, some exchanges may or may not
be quoting/trading during that specific time. This features allows you to see
specific exchanges available during the exact sequence on the chart.
"L" - Draws an item as a line segment.
"P" - Draws an item as a point.
|
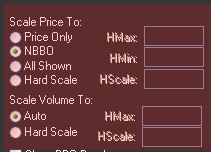 |
Scale Price To:
- Price Only- Scales the chart based only on trade prices.
- NBBO - Scales the chart to the NBBO (Composite Bids and Asks).
- All Shown - Scales the chart to all items being charted.
- Hard Scale - Allows you to enter the chart scaling.
Scale Volume To:
- Auto- Scales automatically depending on what is being charted.
- Hard Scale - Allows you to enter the chart scaling.
|
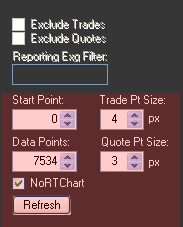 |
Data Points and Point Sizes:
- Start Point- Starting bar to be charted. Sequences will always start
at 0 but can be zoomed into or out of.
- Data Points - Number of data points to chart.
- Trade Pt Size - When trades are plotted as points, this is the
radius size of the point.
- Quote Pt Size - When trades are plotted as points, this is the
radius size of the point.
- No RT Chart - When unchecked, the chart is updated immediately when
new data is received or the Data points and point size scrollers are used. When
checked, the chart is not updated until the Refresh Button is pressed.
- Refresh - Refresh the chart.
|
 |
"Show BBO Bands" - Shows the
banding range (whose percent is set in the banding field) from the NBBO.
"QSize x 100" - Because NxCore uses round lots for quote
sizes, the sizes represent the actual size divided by 100. When the round lot
adjustment is made sizes are shown as their actual size. |
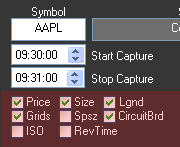 |
Chart Elements:
- Price - Toggles the Price Chart on/off.
- Size - Toggles the Size chart on/off.
- Lgnd - Toggles the legend chart on/off.
- Grids - If on, price and time grids will be displayed in the charts.
- Spsz - When on, splits the size chart into bid/ask components (trade
sizes not available when on). When off charts the bid/ask sizes in the same
charting area.
- CircuitBrd - When on, lines are drawn from one item to the next in
right angles. When off, lines are drawn from point to point, wherever the
points may be.
- ISO - When on, ISO trades are represented on the chart as triangles.
When off, ISO trades are displayed as any other trade.
- RevTime - When on, draws the time line from the finish to the start.
When off, draws the timeline from the start to the finish. Because the timeline
is non-linear, this will effect where individual times are plotted.
|
 |
"Symbol" - Symbol you wish to
view in the chart.
"Start Time" - Start time of the sequence you would like to
capture. Sequences are inclusive of the start time. When a new time is entered,
the stop time will be adjusted to 1 minute ahead of the start time (the default
sequence view).
"Stop Time" - Stop time of the sequence you would like to
capture. You may capture as little as 1 full second. Sequences are exclusive of
the stop time. |
 |
"Exclude Trades" - When checked
trades are excluded from the sequence entirely. When unchecked all trade
information is included.
"Exclude Quotes" - When checked quotes are excluded from the
sequence entirely. When unchecked all quote information is included.
"Reporting Exch Filter" - If blank, all exchanges
quoting/trading are captured in the sequence. You may enter the exchange number
(or multiple exchanges by separating each exchange number with a comma) that
you wish to include in the sequence. All other exchanges are excluded. |
|
For a small tutorial on using the QTSequencer, see this page
"Finding The Knife".
Symbol Convention:
Since this application is specific to equities, you may enter symbols with or
without the lowercase 'e'. Examples would be "eIBM" (the standard
NxCore convention for equities) or just "IBM". By default only US
Equities are used (although this can be modified by changing the exchange map
entries in the INI file).
If the symbol entered is not valid, a "Symbol Not Found" message is
displayed in the Name field.
Colors and Additional Settings:
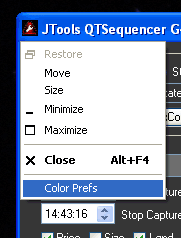
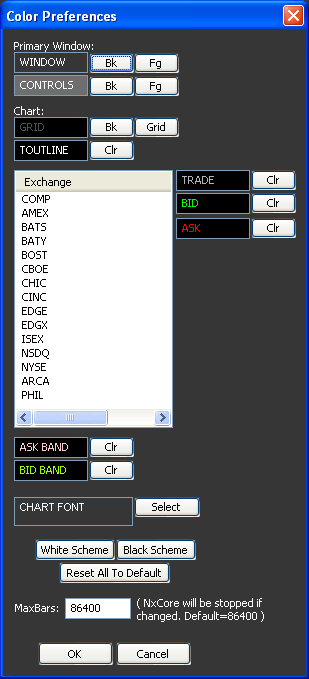
You may change colors for he entire application by clicking on the application
icon in the upper left corner, and choosing 'Color Prefs / Settings':
NOTE: Because the number of data elements to be plotted is not known before the
plot, the sequence may contain more items than have been allocated for the
chart. If this occurs, then a message will appear "Complete - More Data
Exists" when the sequence is complete:

To increase the amount of memory reserved for the data you can set the number
of points to allocate in the 'Max Bars' field. It is limited only to
available memory.
JTools Table of Contents
|