Our analysis of the
Waddell & Reed e-Mini trades led us to an unexpected break-through. By
process of elimination, and with the SEC report for context, we finally have a
crystal clear understanding what caused the May 6, 2010 flash crash.
First of all, the Waddell & Reed trades were not the cause, nor the
trigger. The algorithm was very well behaved; it was careful not to impact the
market by selling at the bid, for example. And when prices moved down sharply,
it would stop completely.
The buyer of those contracts, however, was not so careful when it came to
selling what they had accumulated. Rather than making sure the sale would not
impact the market, they did quite the opposite: they slammed the market with
2,000 or more contracts as fast as they could. The sale was so furious, it
would often clear out the entire 10 levels of depth before the offer price
could adjust downward. As time passed, the aggressiveness only increased, with
these violent selling events occurring more often, until finally the e-Mini
circuit breaker kicked in and paused trading for 5 seconds, ending the market
slide.
Because of arbitration, when the e-Mini changes price with high volume, many
ETFs are repriced (quotes updated, trades executed). The component stocks of
ETFs are also repriced, along with many indexes. And finally, all the option
chains for the ETFs, their components and indexes are also repriced. The entire
system simply cannot absorb the impact of a sudden move in the e-Mini on high
volume. A sale (or purchase) of 2,000+ contracts which rips through one-side of
the depth of book in 50-100 milliseconds, will immediately overload many
systems. The impact reverberates for a much longer period of time than the sell
(or buy) event itself.
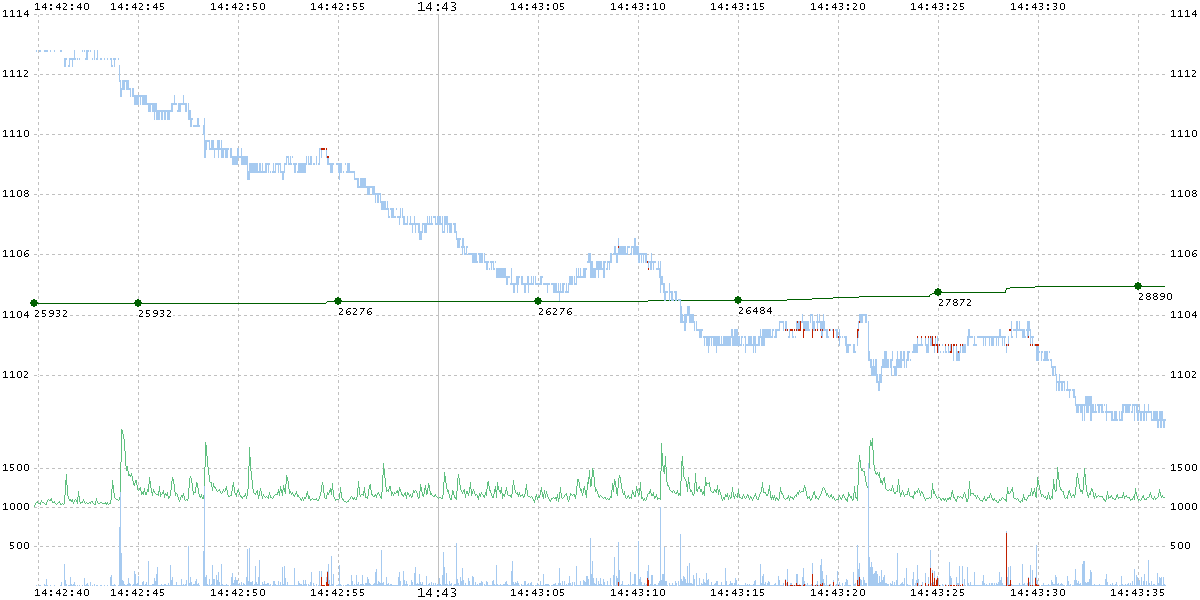
The first large e-Mini sale slammed the market at approximately 14:42:44.075,
which caused an explosion of quotes and trades in ETFs, equities, indexes and
options -- all occurring about 20 milliseconds later (about the time it takes
information to travel from Chicago to New York). This surge in activity almost
immediately saturated or slowed down every system that processes this
information; some more than others. Two more sell events began just 4 seconds
later (14:42:48:250 and 14:42:50:475), which was not enough time for many systems to recover from
the shock of the first event. This was the beginning of the freak sell-off
which became known as the flash crash.
In summary, the buyers of the Waddell & Reed e-Mini contracts, transformed
a passive, low impact event, into a series of large, intense bursts of
market impacting events which overloaded the system. The SEC report uses an
analogy of a game of hot-potato. We think it was more like a game of dodge-ball
among first-graders, with a few eighth-graders mixed in. When the
eighth-graders got the ball, everyone cleared the deck out of panic and
fear.
|

|
The chart above shows the high and low prices of the eMini for each 100ms
interval (light blue). The green line with green dots and numbers shows the
total number of Waddell & Reed contracts sold up to that point. Red price
bars indicate the range of prices of W&R trade executions during that
period. The light blue bars in the bottom section indicate the volume of eMini
contracts traded in that interval. The scale for the volume is below the scale
of the prices. Finally, the light green line in the chart above, shows the
total number of equity trades in all equities during that 100ms interval --
there is no scale for this line -- it is shown to illustrate the correlation
with the eMini contract volume traded during the same interval.
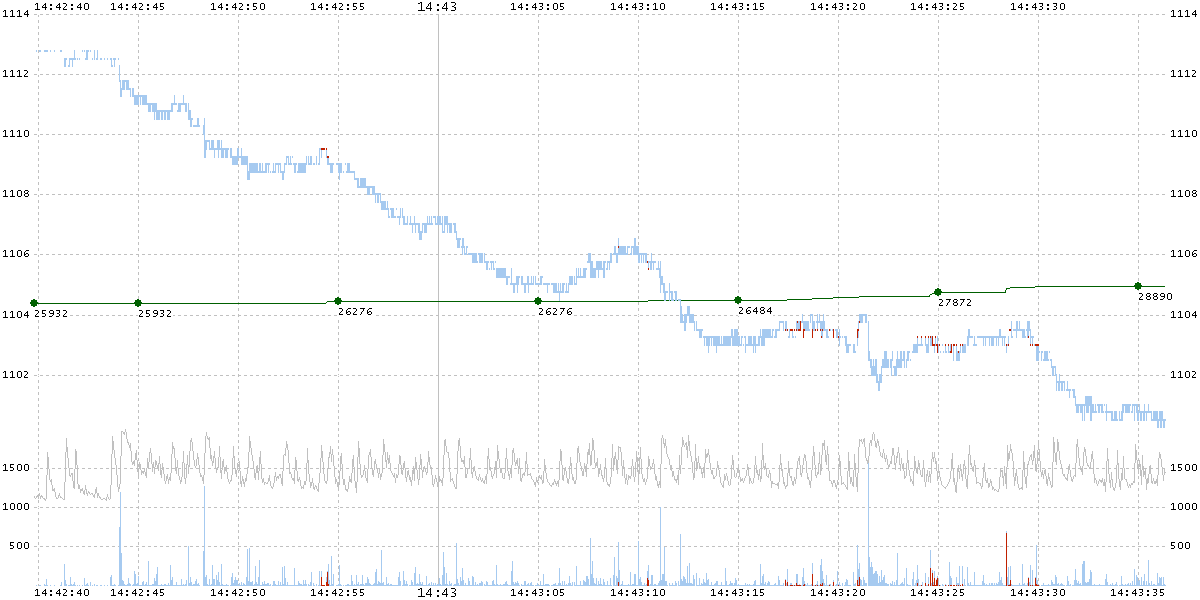
The chart below is the same as the chart above, except in place of the trade
counts (light green above), it shows the quote counts for all equities during
each interval (light gray).

|
Inquiries: pr@nanex.net
Publication Date: October 14, 2010
http://www.nanex.net
| This report and all material shown on this
website is published by Nanex, LLC and may not be reproduced, disseminated, or
distributed, in part or in whole, by any means, outside of the recipient's
organization without express written authorization from Nanex. It is a
violation of federal copyright law to reproduce all or part of this publication
or its contents by any means. This material does not constitute a solicitation
for the purchase or sale of any securities or investments. The opinions
expressed herein are based on publicly available information and are considered
reliable. However, Nanex makes NO WARRANTIES OR REPRESENTATIONS OF ANY SORT
with respect to this report. Any person using this material does so solely at
their own risk and Nanex and/or its employees shall be under no liability
whatsoever in any respect thereof. |
|
|
|
 |
|

