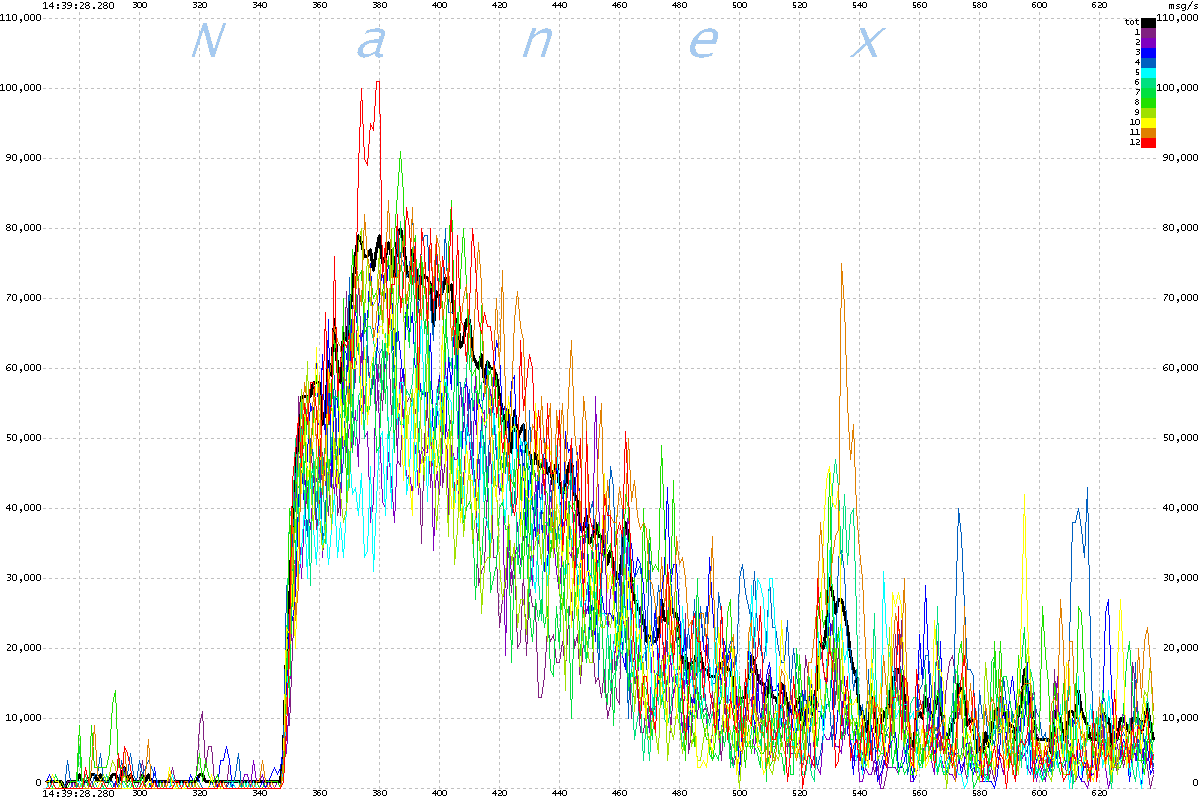
Back to Table Of Contents CQS transmits on 12 multicast lines in order to distribute the processing load. The capacity guidelines, expressed in quotes per second, are as follows: Before July 5, 2011 75,000 per Multicast line and 750,000 for all 12 multicast lines Beginning July 5, 2011 100,000 per Multicast line and 1,000,000 for all 12 multicast lines The following charts plot each of the 12 individual CQS multicast lines and the total (which is divided by 10 to fit into the same scale) on a 1 millisecond basis. The scale is expressed as quotes/second. What becomes immediately apparent is that the total line never gets higher than the 1-second capacity rate in any 1 millisecond period -- but normal market behaviour tells us that it should. This indicates to us, that saturation is occurring at these times.
Starting July 5, the capacity increased 25%, yet that same day, we find clear indications of capacity saturation occurred at the new higher levels. This confirms our original supicion of capacity saturation and allows us to estimate the extent of saturation and delays.

|

