07/27/2011 - Direct Feed Slowdown (Latency) on Demand
|

Back to Table Of Contents
We have analyzed book level data, a direct feed from a prominent exchange, for May 6, 2010. The same data
the SEC used for the
October 2010 report on the flash crash. It took about 3 hours for us to discover
what the SEC either missed or chose to omit: this direct feed
experienced significant
delays and showed all the signs of being overloaded. There
is a very clear relationship
between message traffic and the extent and duration of the delay. Anyone who
has worked with market data would have easily discovered this revelation within a
day or two. The SEC report even mentions an average delay for this direct feed which makes
the omission even more troubling.
This discovery is important because it illustrates how someone could cause latency
in a direct exchange feed whenever they wanted: simply send and cancel orders at a
high enough rate. A rate that turns out to be, not very high. Last year we
published a report about a similar mechanism we discovered on an inbound line
into CQS. We now believe other direct feeds also exhibit delays when message rates
exceed a threshold. It would seem to us, that having detailed information on the relationship
between message rate and delay would be vital for HFT firms
to compete.
|
Someone could slow down a direct exchange feed whenever they want, by simply sending and canceling orders at a high enough rate.
|
We also found that activity increases to a maximum, and then falls off significantly
beginning at 14:42:44; this is extraordinary given that the market was about to drop
600 points in one of the most violent sell-offs ever recorded. This also just happens
to be the exact point in time where an aggressive algorithm started and without regard to the precarious state of the market, violently sold a few thousand
S&P 500 futures contracts and simultaneously, sold a few hundred million dollars worth of ETFs, such
as SPY, IWM, QQQ, and DIA. This is long before any stub quotes or liquidity replenishment
points or the infamous hot-potato game began.
We think it is time for a Senator or Representative to call for an investigation on how such obvious
and key pieces of evidence could have been omitted from the findings. Findings that
are now driving new regulations. Is it wise to base regulations on a faulty understanding
of what you are trying to regulate?
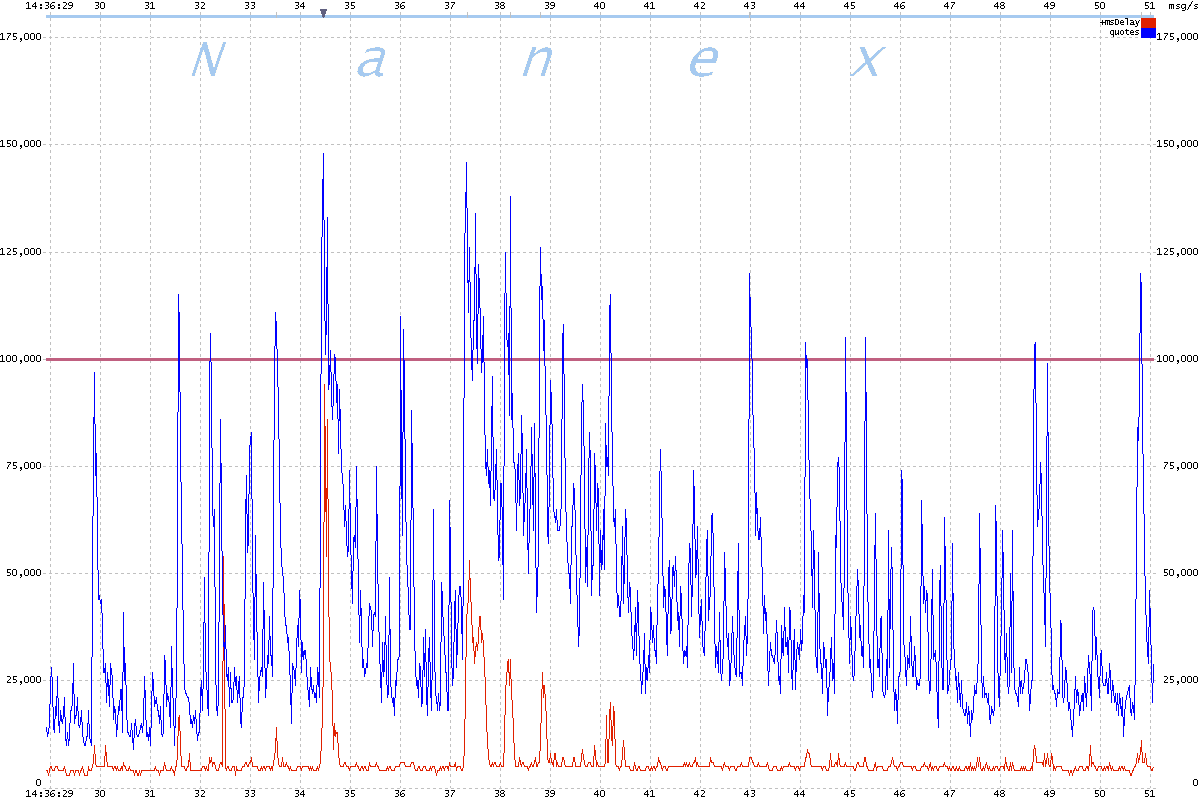
The first set of charts illustrate the relationship between quote message
traffic and delay in a direct exchange feed on May 6, 2010. We count the number of new and canceled orders for each 20ms period and plot this as a blue line, scaled
in messages/second (msg/s). We also take an average of the difference between the
Source and Send time fields, and plot this as a red line scaled in
microseconds: a value of 25,000 means the average delay was 25,000
microseconds or 25 milliseconds during the interval.
Note the strong correlation between message rate and delay: whenever traffic exceeds approximately 100,000 msg/s (indicated by the horizontal red line), a delay appears.
The extent and duration of the delay is proportional to the extent and duration that
traffic exceeds this threshold. We discovered this within 3 hours of receiving the data; it was trivial to find.
|
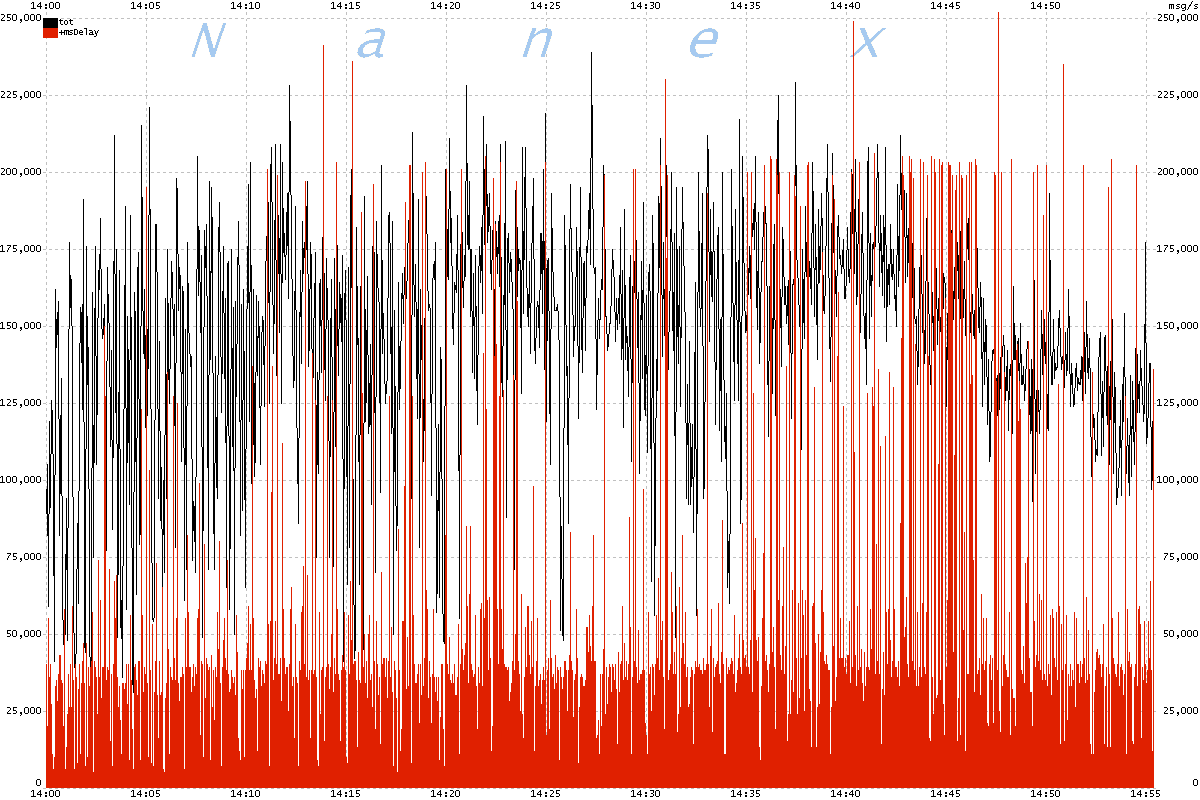
The next chart shows peak message rate and delay in the direct feed from 14:00 to 15:00 on May 6th, 2010. Note how often the delay (red line)
peaks right at 200,000 microseconds: this is very suspicious and merits additional investigation. Many delays
also appear near 35,000 microseconds. Finally, note how often the peaks in message
rate are at the same level: this is a common phenomenon on saturated networks.
|
3 Second Peak Message Rate and Delay
The next chart shows the collapse of activity begin at 14:42:44. This is a plot of
order messages (quotes) and order executions (trades) averaged over 1 second intervals.
|
1 Second Average Quote and Trade Rates on Direct Exchange Feed
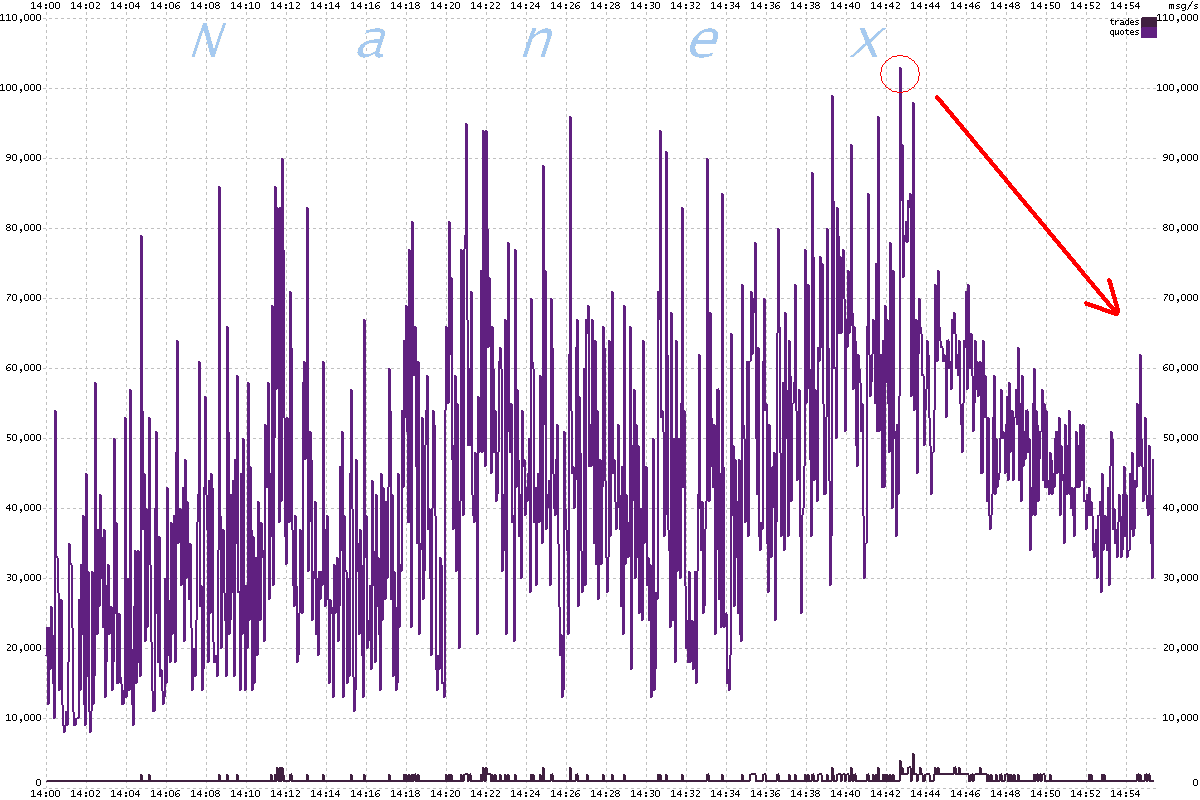
1 Second Average Quote and Trade Rates on Direct Exchange Feed (zoomed in)
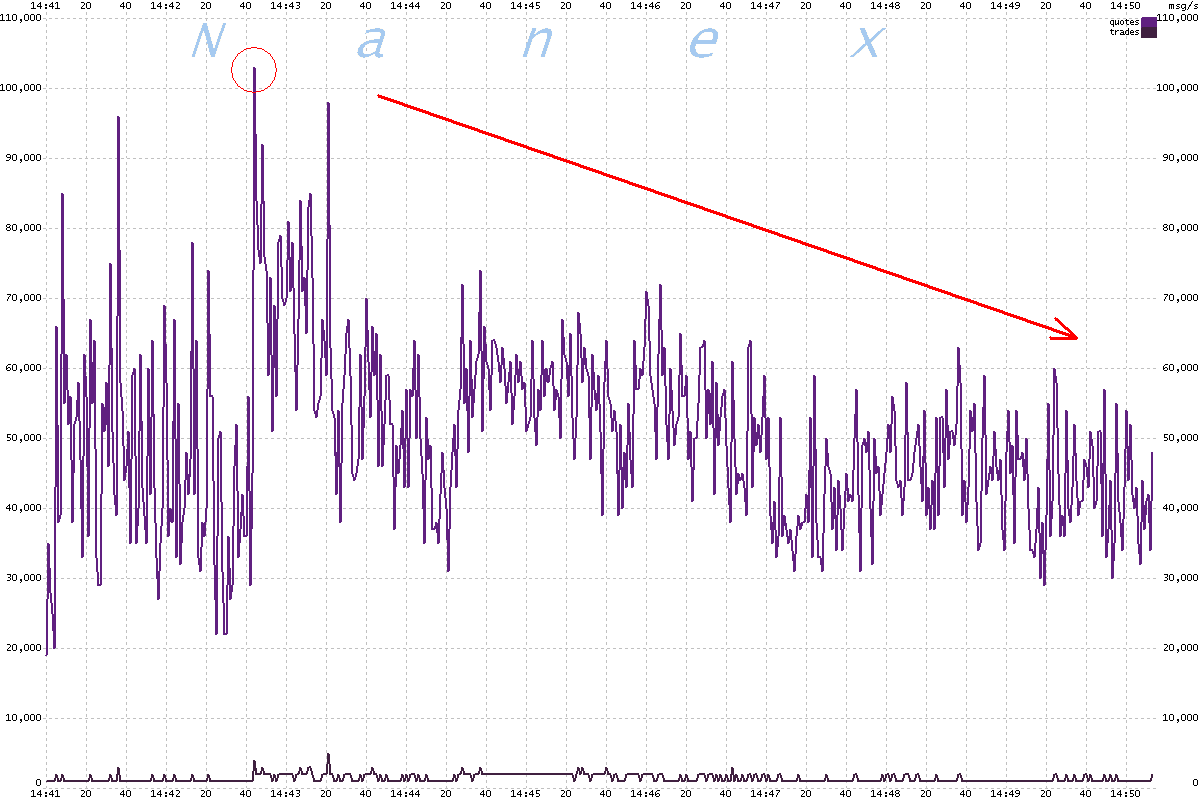
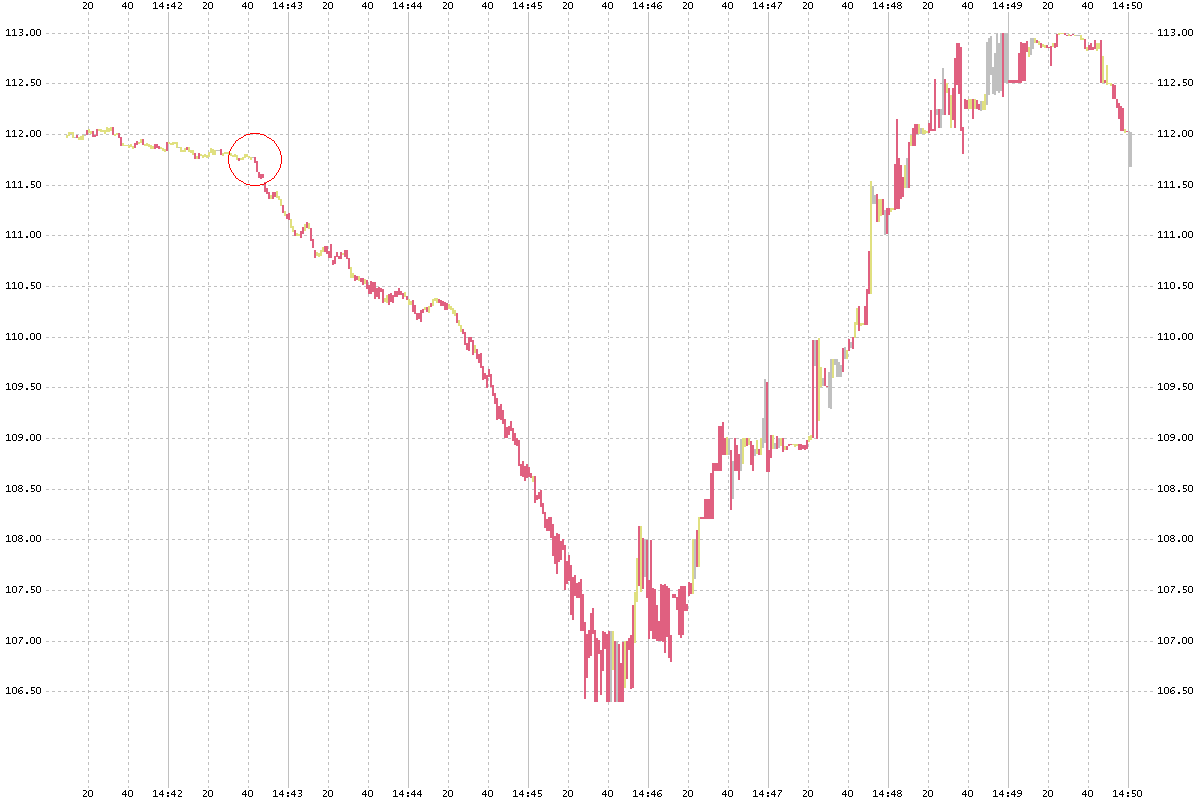
For reference, the next chart shows prices for SPY, an ETF representing stocks in the S&P 500. Circled is is the trigger point at 14:42:44.
|
Chart of SPY
| |
Inquiries: pr@nanex.net
Publication Date: 07/27/2011
http://www.nanex.net
| This report and all material shown on this
website is published by Nanex, LLC and may not be reproduced, disseminated, or
distributed, in part or in whole, by any means, outside of the recipient's
organization without express written authorization from Nanex. It is a
violation of federal copyright law to reproduce all or part of this publication
or its contents by any means. This material does not constitute a solicitation
for the purchase or sale of any securities or investments. The opinions
expressed herein are based on publicly available information and are considered
reliable. However, Nanex makes NO WARRANTIES OR REPRESENTATIONS OF ANY SORT
with respect to this report. Any person using this material does so solely at
their own risk and Nanex and/or its employees shall be under no liability
whatsoever in any respect thereof. |
|
|
|


