Back to
Table Of Contents
Update April 2, 2012: Added new charts at bottom.
Enough Already!
On Friday, Aug 5, 2011, we processed 1 trillion bytes of data for all U.S. equities,
options, futures, and indexes. This is insane. A year ago, when we processed
half of that, we thought it was madness. A year before that, when it was 250
billion bytes, we thought the same. There is no new beneficial
information in this monstrous pile of data compared to 3 years ago. It is
noise, subterfuge, manipulation. The root of all that is wrong with today's
markets.
HFT is sucking the life blood out of the markets: liquidity. It is almost comical,
because this
is what they claim to supply. No one with any sense wants to post a bid or ask,
because they know it will only get hit when it's at their disadvantage. Some
give in, and join the arms race. Others leave.
Take the electronic S&P 500 futures contract, known as the emini, for example. This is, or used to be, a very liquid market.
The cumulative size in the 10 levels in the depth of book was often 20,000
contracts on each side. That means a trader could buy or sell 20,000 contracts
"instantly" and only move the market 10 ticks or price levels. Even
during the flash crash, before the CME halt,
when hot potatoes were flying everywhere, the depth
would still accommodate an instant sale of 2,000 contracts.
What used to be the most liquid and active contract in the
world, which served as a proxy for the true price of the US stock market for decades,
is getting strangled by the speed of light, a weapon wielded by HFT.
Not anymore. On Friday, 2,000 contracts would have sliced right through the
entire book. Not during a quiet period, or before a news event. Pretty much any
minute of trading that day after the 9:54 slide. And it wasn't just Friday, the trend in the depth
of book size has been declining rapidly over the last few week. What used to be
the most liquid and active contract in the world, which served as a proxy for
the true price of the US stock market for decades, is getting strangled by the
speed of light, a weapon wielded by HFT.
Without going into detail at this time, we think we know one cause of the drop
in liquidity. A certain HFT algorithm that we affectionately refer to as The Disruptor,
will sell (or buy) enough contracts to cause a
market disruption. At the same exact time, this algo softens up the market in
ETFs such as SPY, IWM, QQQ, DIA and other market index symbols and options on
these symbols. When the disruptor strikes, many professional arbitrageurs who
had placed their bids and offers in the emini suddenly find themselves long or
short, and when they go to hedge with ETFs or options, find that market soft
and sloppy and get poor fills. Naturally, many of these arbitrageurs realize
the strategy no longer works, so they no longer post their bids and offers in
the emini. Other HFT algos teach the same lesson -- bids or offers resting in
the book will only become liabilities to those who can't compete on speed.
In summary, HFT algos reduce the value of resting orders and increase the value
of how fast orders can be placed and cancelled. This results in the illusion of
liquidity. We can't understand why this is allowed to continue, because at the
core, it is pure manipulation.
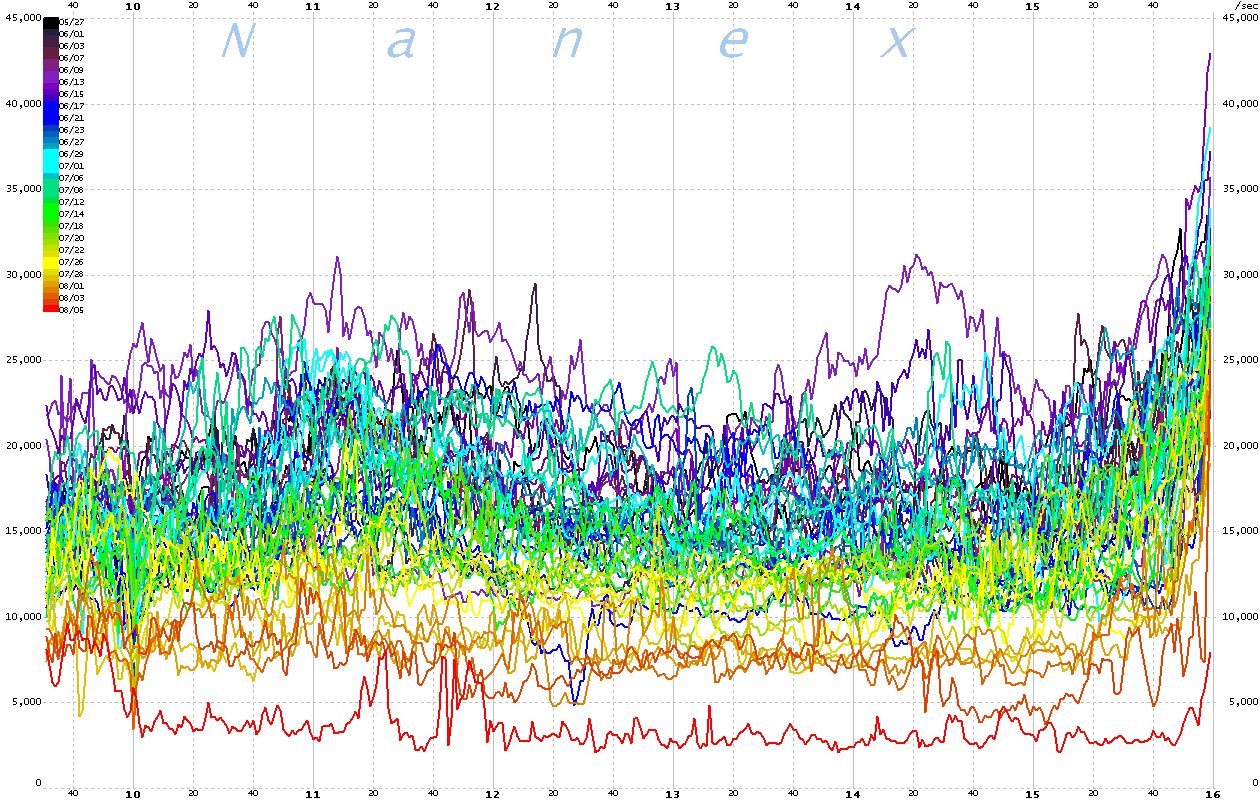
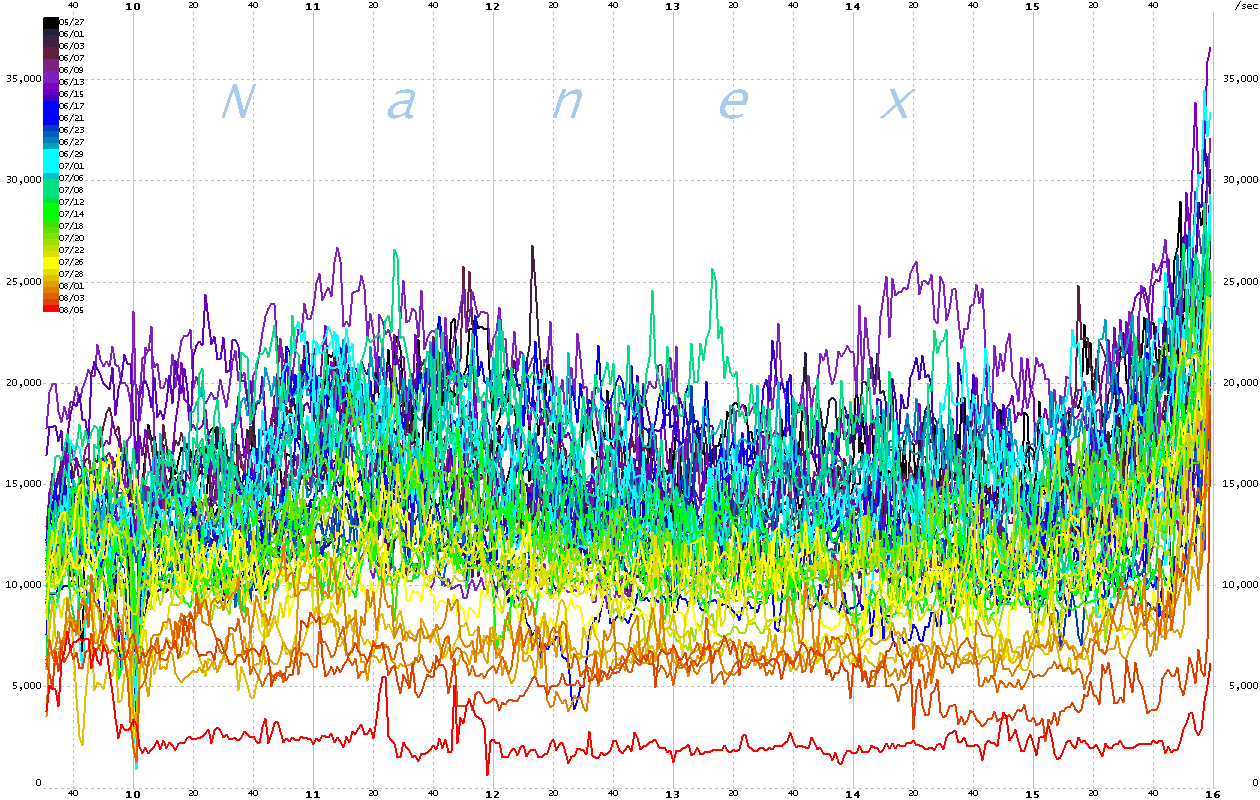
The charts below shows the sum of all 10 depth of book bid sizes over each minute of the trading day. This is an excellent measure of liquidity in the emini. The red line
at the bottom is Friday, Aug 5, 2011. Note how liquidity has been falling off sharply
over the last few weeks.
|
Average Sum of Bid Depth Sizes (click for hi-res chart)

Minimum Sum of Bid Depth Sizes (click for hi-res chart)

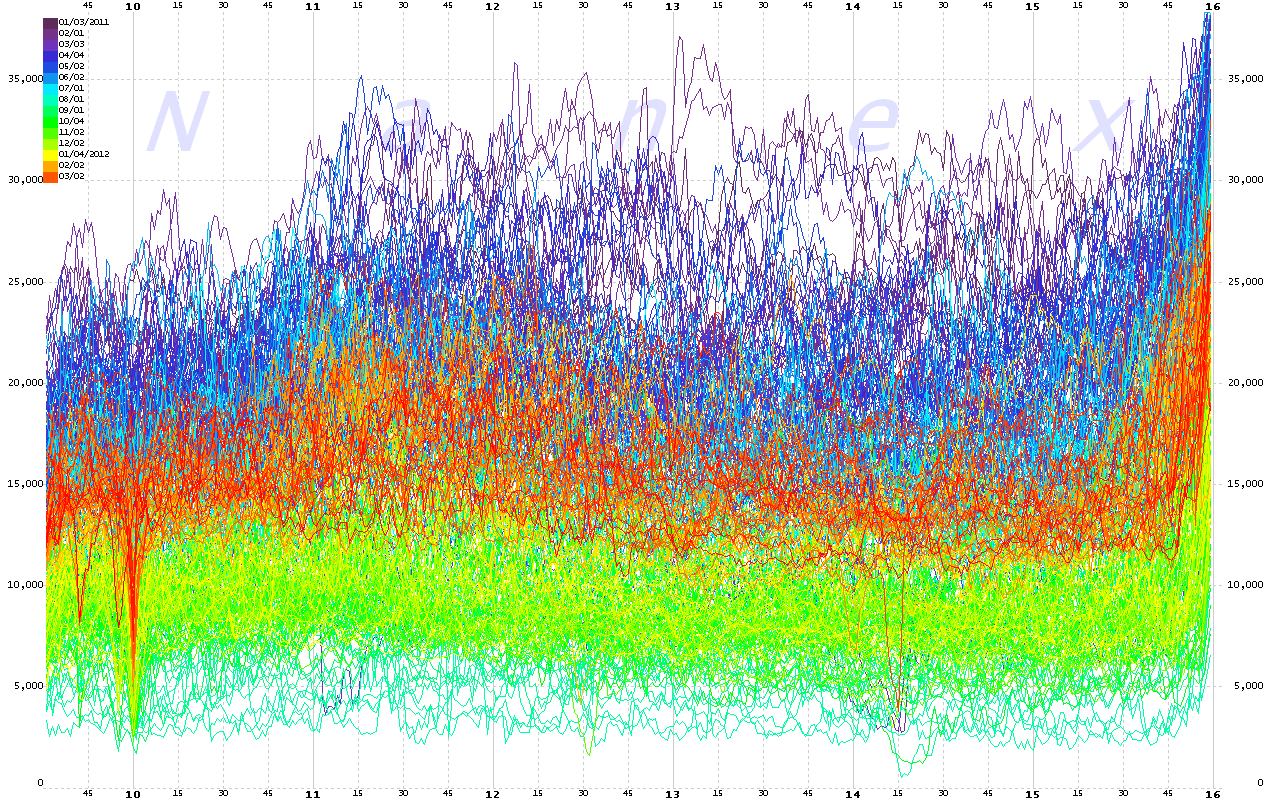
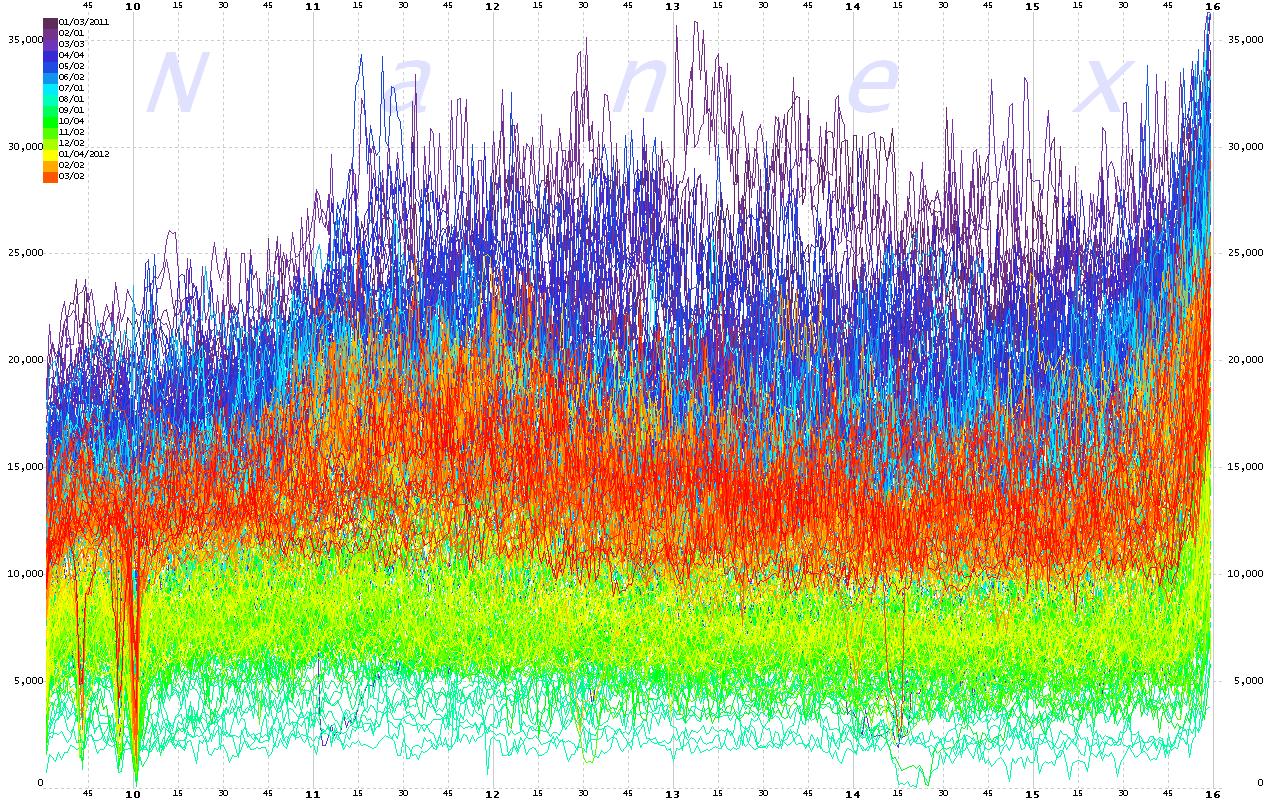
The emini depth has increased from the extreme lows in August 2011, but has not recovered
to year ago levels.
Average Sum of Bid Depth Sizes from January 2011 - March 2012 (click for hi-res chart)

Minimum Sum of Bid Depth Sizes from January 2011 - March 2012 (click for hi-res chart)

| |
Inquiries: pr@nanex.net
Publication Date: 08/08/2011
http://www.nanex.net
| This report and all material shown on this
website is published by Nanex, LLC and may not be reproduced, disseminated, or
distributed, in part or in whole, by any means, outside of the recipient's
organization without express written authorization from Nanex. It is a
violation of federal copyright law to reproduce all or part of this publication
or its contents by any means. This material does not constitute a solicitation
for the purchase or sale of any securities or investments. The opinions
expressed herein are based on publicly available information and are considered
reliable. However, Nanex makes NO WARRANTIES OR REPRESENTATIONS OF ANY SORT
with respect to this report. Any person using this material does so solely at
their own risk and Nanex and/or its employees shall be under no liability
whatsoever in any respect thereof. |
|
|
|


