High
Freak Volatility
An example of HFT causing explosive volatility
|
On October 3, 2011 beginning at 11:10:00.450, in the stock CA Technologies (symbol
CA), a bizarre interaction between multiple HFT algorithms caused a wild oscillation
in the NBBO with over 1,000 trades executing in a 30 cent range. Just before and after
the event, the bid-ask spread was a narrow 1 cent, and trades executed normally in
a 1 cent range. Essentially HFT caused the bid-ask spread to widen from 1 cent to
30 cents in the blink of an eye.HFT caused the spread to widen from 1 cent to 30 cents in the blink of an eye
During the event, the quote rate exceeded 25,000 quotes/second, which caused significant
quote delays of up to 1/2 second for this stock (and probably others processed on the
same exchange equipment). Note that this is similar to an event which occurred in
YHOO that we
described as HFT trading faster than the speed of light (satire).
The one question that needs to be answered and addressed:
Why are trades printing with earlier timestamps than the orders (quotes) on
which they were executed? Up to 1/2 second earlier, which we have been told is an
eternity these days.
|
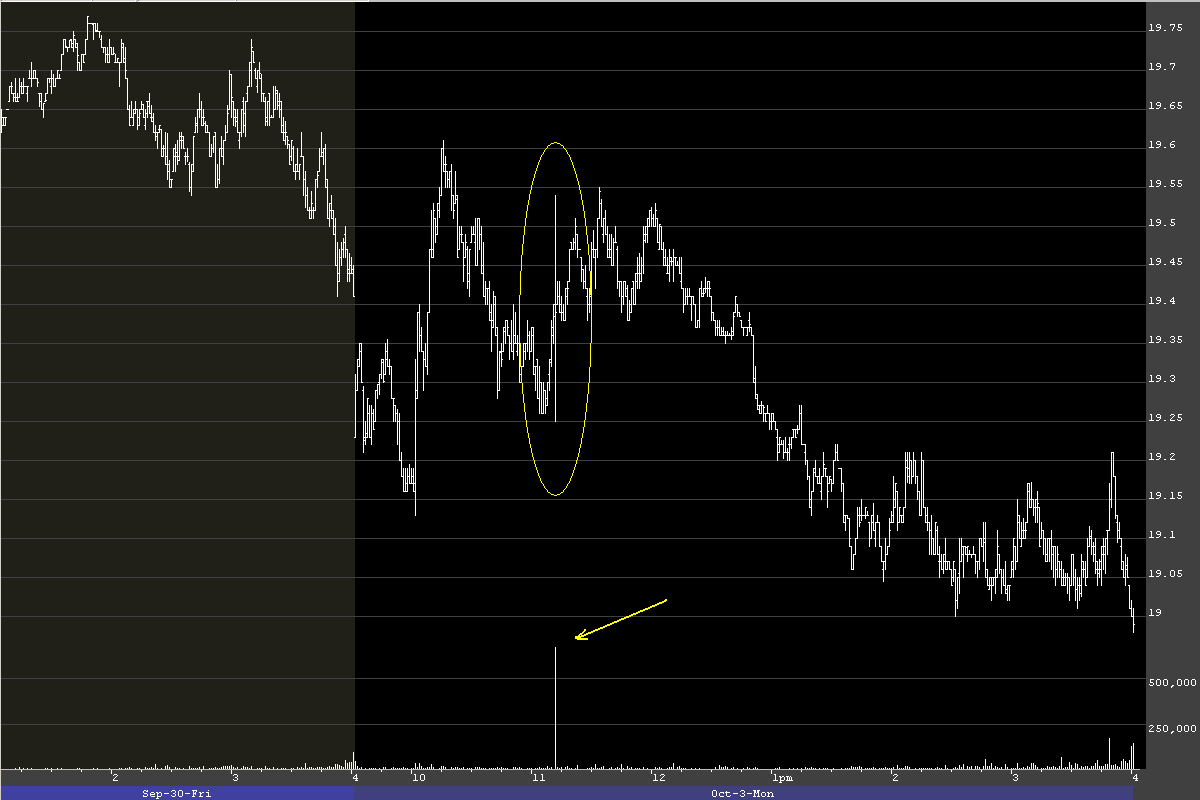
Below is a 1 minute OHLC bar chart of CA with trade
volume shown as a histogram at the bottom. The event occurred in the area circled in yellow. That spike occurred
in less than 1 second. Note the massive spike in trading volume (yellow arrow). Wasn't
this called
"painting the tape" at one time?
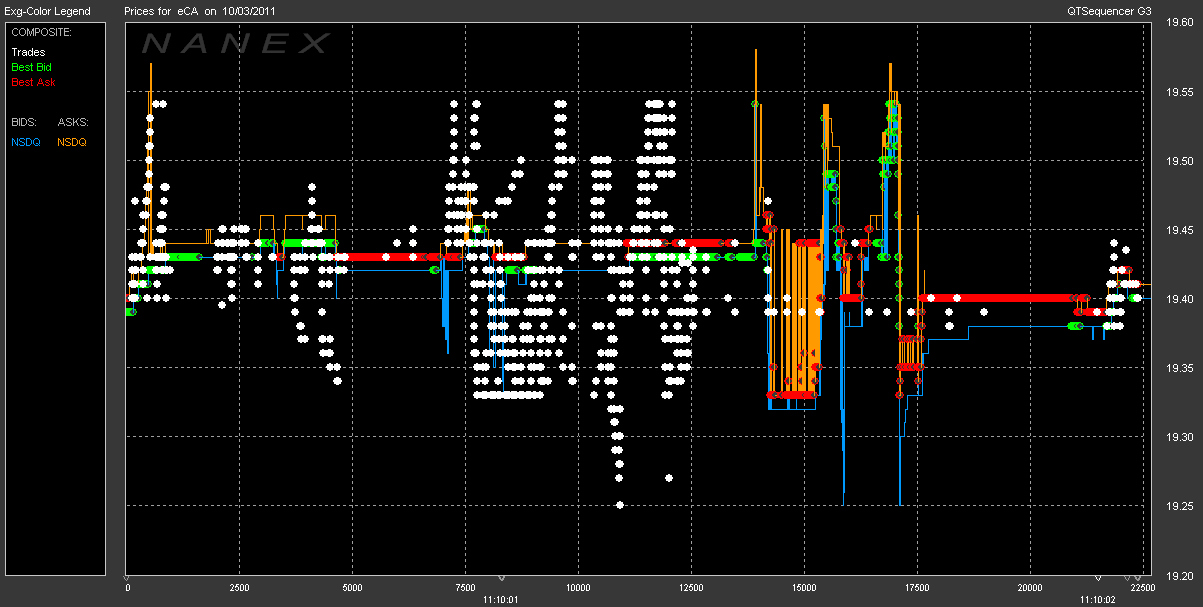
Below is a tick chart showing the NBBO along with trades and quotes from one exchange.
The time scale on the bottom shows both tick count and time.
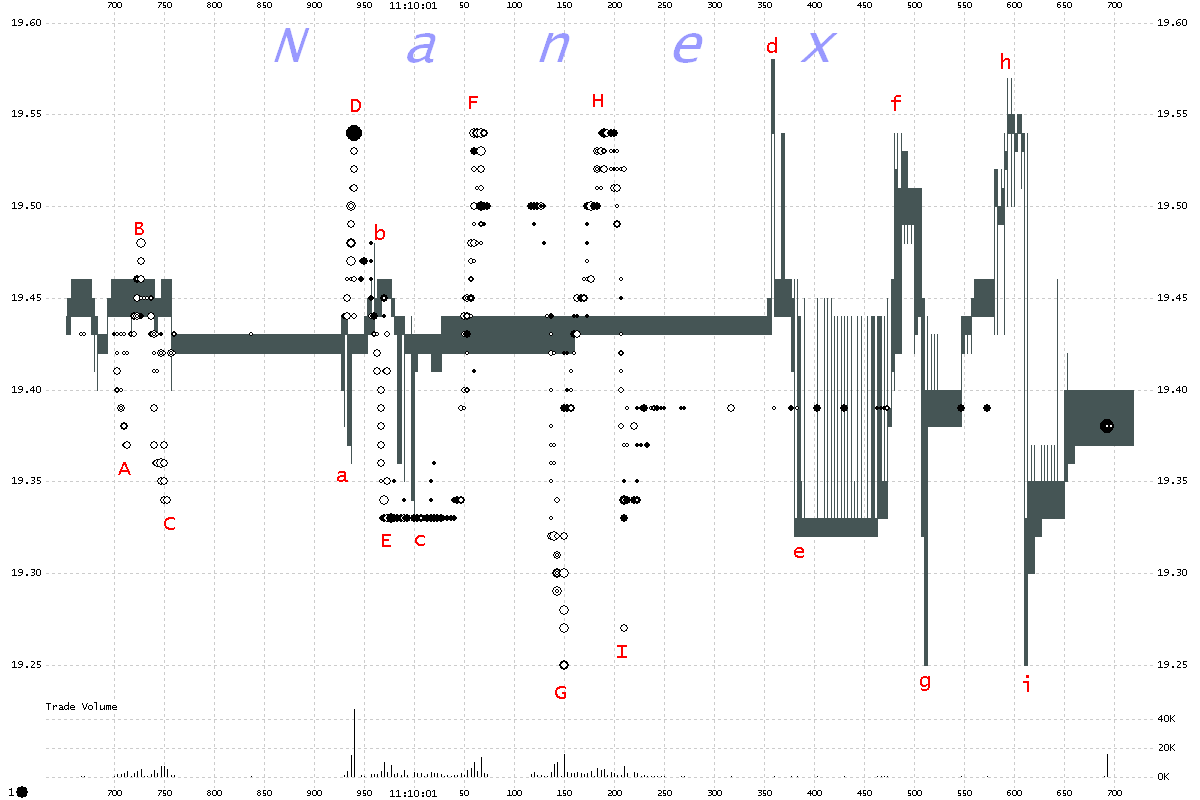
Below is a 1 millisecond interval chart showing trades as circles and the bid-ask
spread as vertical lines from one exchange (Nasdaq). To
get an idea of the extent of the delay, simply match the upper case letters (where trades occurred) to the lower case letters (where the corresponding quotes occurred). We could fantasize that this is
HFT trading faster than the speed of light and call the negative difference fantaseconds, but we know better.
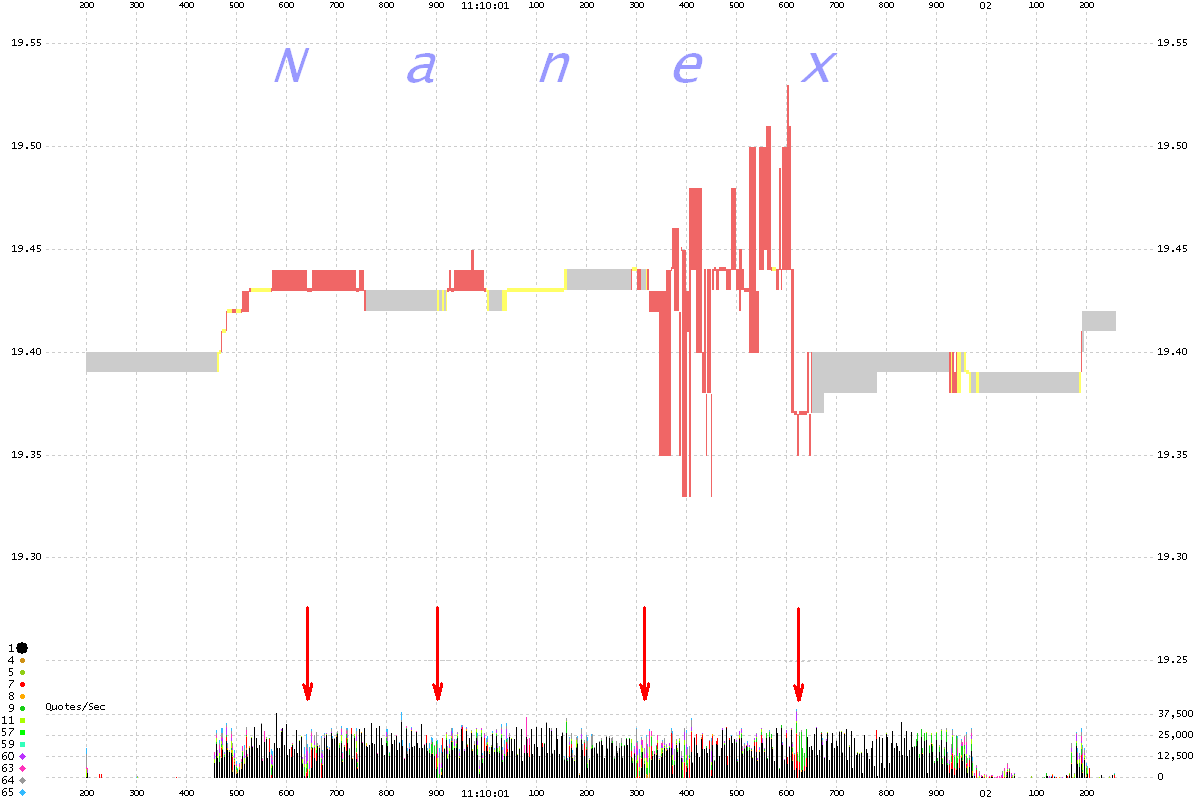
Below is a 2 millisecond interval chart of the NBBO in CA which is plotted as vertical
lines and colored red if the NBBO was crossed during the interval, yellow if it was
locked, and gray if it was normal. The implied quote rate is scaled in quotes/second
and shown at the bottom as a stacked histogram colored by contribution from each exchange.
Note that when quotes from Nasdaq dissipate (black decreases -- see red arrows), the
quote rate from the other exchanges increases to take up the difference. This is an
indication of saturation.
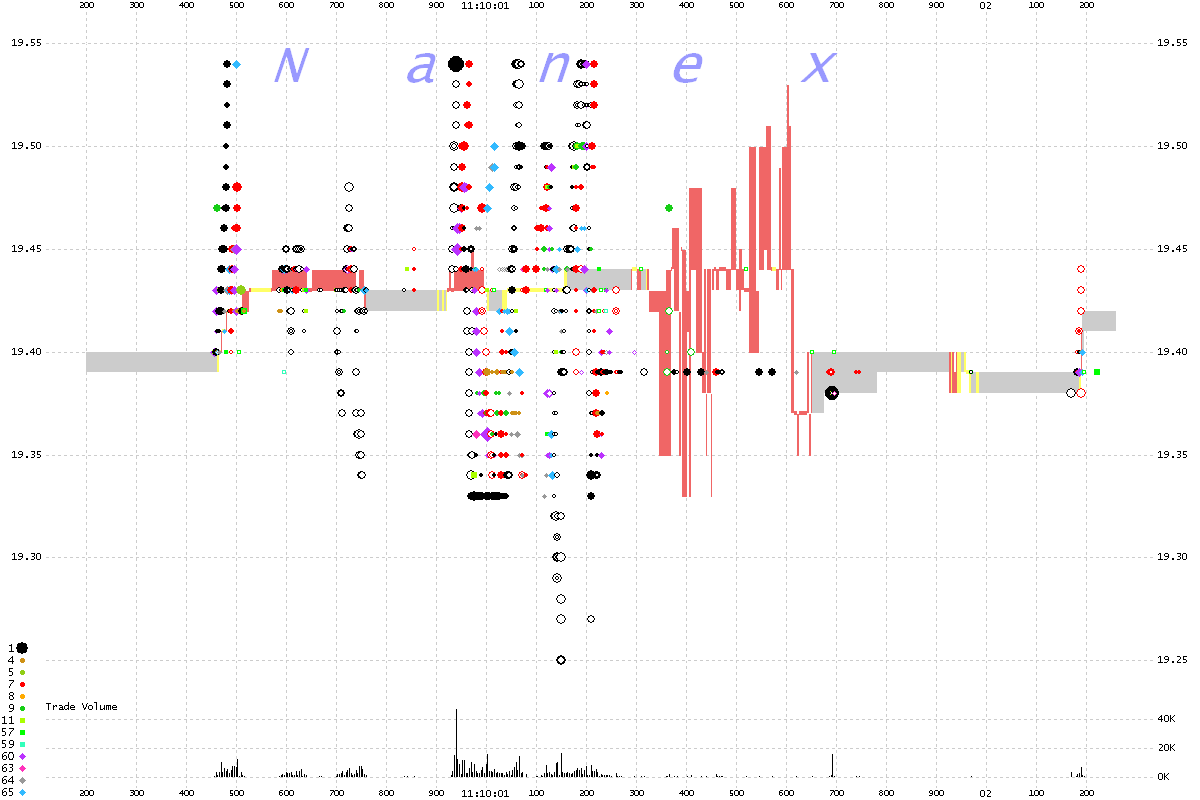
The chart below is the same as the one above, with trades added. Trade volume is shown
in place of Quote Rate.
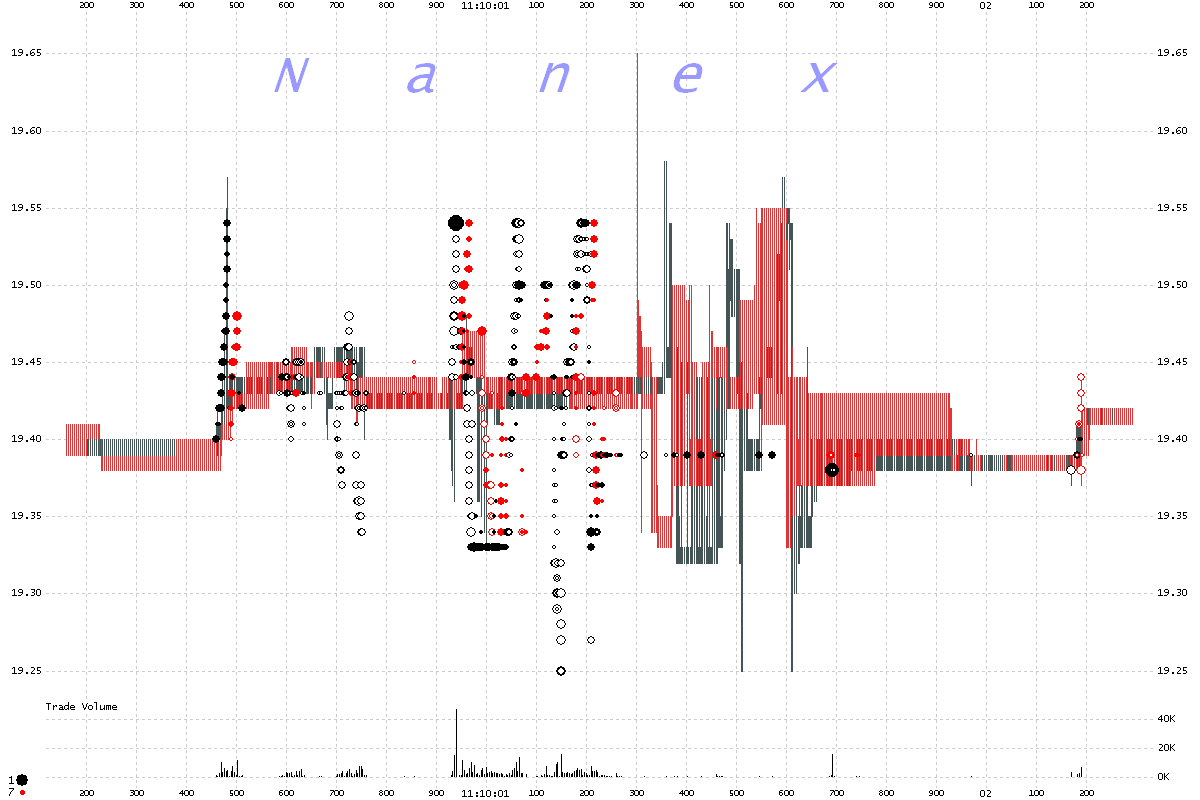
The chart below shows the bid-ask spread and trades from two exchanges: Nasdaq (black)
and NYSE/ARCA (red).
|
Inquiries: pr@nanex.net
Publication Date: 10/03/2011
http://www.nanex.net
| This report and all material shown on this
website is published by Nanex, LLC and may not be reproduced, disseminated, or
distributed, in part or in whole, by any means, outside of the recipient's
organization without express written authorization from Nanex. It is a
violation of federal copyright law to reproduce all or part of this publication
or its contents by any means. This material does not constitute a solicitation
for the purchase or sale of any securities or investments. The opinions
expressed herein are based on publicly available information and are considered
reliable. However, Nanex makes NO WARRANTIES OR REPRESENTATIONS OF ANY SORT
with respect to this report. Any person using this material does so solely at
their own risk and Nanex and/or its employees shall be under no liability
whatsoever in any respect thereof. |
|
|
|


