New SEC Limit Up/Down Proposal Would
Have Made Flash Crash Worse
Bellwether stocks halted and frozen near the bottom! See charts
below.
|

Back to Main Research Page
We have read the SEC
Limit Up/Limit Down Plan to Address Extraordinary Market Volatility (LULD,
or the plan). We have also read through the comments
submitted to the SEC by knowledgeable professionals in the industry, and we agree with nearly all of
the concerns presented. There are a few worrisome problems that are not presently
addressed in the commentary nor the plan itself. These troubling concerns were not immediately
apparent; they only presented themselves after we undertook the effort to simulate
what would have happened on May 6th, 2010 if the plan was in effect. That was the
day of the flash crash, which is the whole reason this
plan is being proposed. We'll
briefly mention the most troubling concerns we found, so that we can keep this paper
short.
No software developer with any sense was part of this process.
The first thing we discovered when coding the LULD rules, is that no software developer
with any sense was part of this process. This we are sure of. Let us explain. There
is a need to have reliable prices for calculating trading bands, because triggering
false trading halts could be far worse than not having a limit at all. The plan
tries
to achieve stable prices by averaging all trades over the last 5 minutes. This method
is extremely processor and memory intensive, because for each symbol, the software
needs to buffer anywhere
from 1 to 100,000 or more trades. Worse, stocks that hardly trade will have just a few trades (or none) in the last 5 minutes: so the very stocks that need
a price stabilization method will get no benefit from this approach! The best way to ensure stable prices
with minimal processor and memory overhead is to use an
exponential moving average.
The second glaring problem is one of
robustness, or rather a lack of robustness. Readers should know that trades and quotes are processed by
separate systems, which
are often out of sync by hundreds of milliseconds during normal trading, and many
times that amount during active (not
crazy) trading. However, the plan assumes,
at its very core, that these two very different systems will magically always be in
sync. And this is a plan
designed to alleviate problems during times of severe market stress! Many competent software engineers
have been fired on the spot for less. The solution here, is to pick one of the two systems (hint: use quotes) and avoid
any dependencies.
The third, and perhaps most important problem, is that the plan persists an ambiguity of
the definition of the
NBBO in Reg NMS and how the NBBO is (not) used to route orders
to protected quotations. The ambiguity arises because the language of Reg NMS assumes
that information is transmitted instantly: at the time when Reg NMS was written, the speed of light was so fast it was, practically
speaking, instant. This,
coupled with intense competition to be the fastest at all costs, led to exchanges
using their own internal calculation of the best bid or offer as a substitute for
the real NBBO for order routing and trade through protection.
We think it would be prudent for the SEC to clearly document how an investor's order
is routed through the system at each step in the process, in detail, with particular
attention paid to the step when the NBBO is taken into account.
So it would seem to us that exchanges either have to abandon and rewrite the
order routing layer to adopt the plan as it is written (not very likely),
or they intend to apply the definition of the NBBO to mean the one that each exchange
calculates internally and
ignore the NBBO as defined in Reg NMS.
In light of this continued ambiguity, we think it would be prudent for the SEC to
clearly document how an investor's order is routed through the system at each step
in the process, in detail, with particular attention paid to the step when the NBBO is taken
into account.
Finally, the
delays in quote and trade dissemination from the SIPs are common and
significant enough that it
will lead to new forms of latency arbitrage when stocks approach their limit bands. Latency arbitrage always favors the trader with the fastest
speed, to the detriment of everyone else.
The SEC has proposed many band-aid fixes since May 6, 2010 in an effort to make investors feel confident again
about the equity market. The sad truth though is that none of their proposals so far will prevent another flash crash. Worse,
some proposals, such as this one, will likely make things even worse.
The Simulation
Since it is impossible to simulate what would have happened after
a trading band is hit, we decided to stop the calculations for a stock once it hits
a band. We show
the time and price where a stock hits a band, and where the prices actually traded,
since there was no pause on that day. It is up to you, the reader, to imagine the
impact from halting trading in the stock at the price and time indicated.
On the day of the flash crash,
350 symbols would have hit the price bands as defined by the plan. Of these, only 3 symbols hit their price bands before trade and quote
systems became overloaded and severely stressed.
304 symbols hit bands after the emini began
its 5 second halt.
One saving grace of the flash crash was that it happened so fast, a lot of
people didn't have time to react.
It is very troubling to see so many large capitalization, widely-held stocks triggering
a pause or halt near their very lows. We wonder how this would have impacted index calculations, futures prices, options, ETFs and other equivalent assets. We wonder
how much these halts would have prolonged the event.
One saving grace of the flash
crash was that it happened so fast, a lot of people didn't have time
to react. Many people weren't even aware of the crash, or its severity, until after
it was over.
|
SPY Prices showing when the Limit Up/Down price bands hit. A red dot indicates
when a stock hit its band.

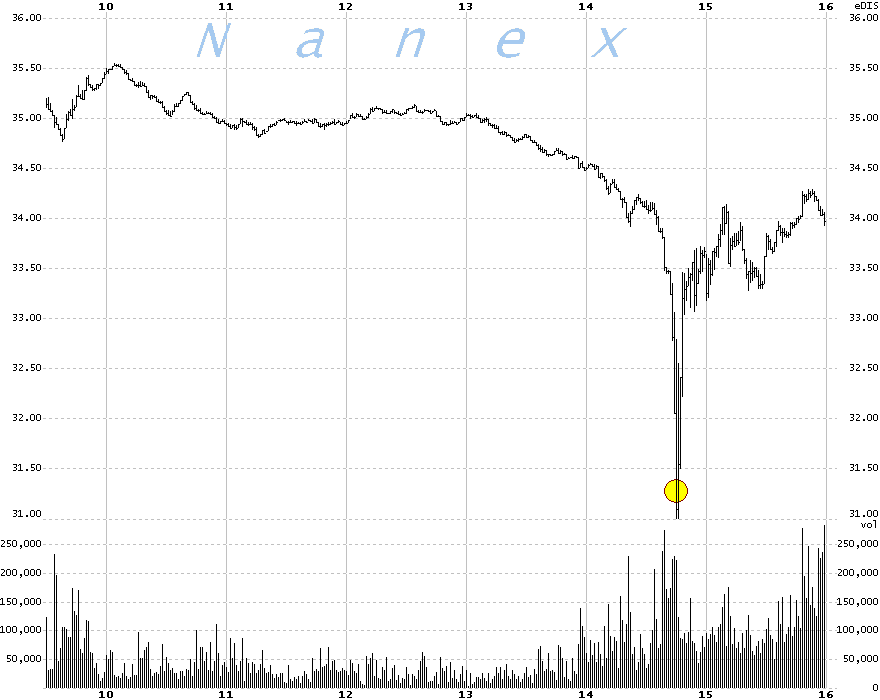
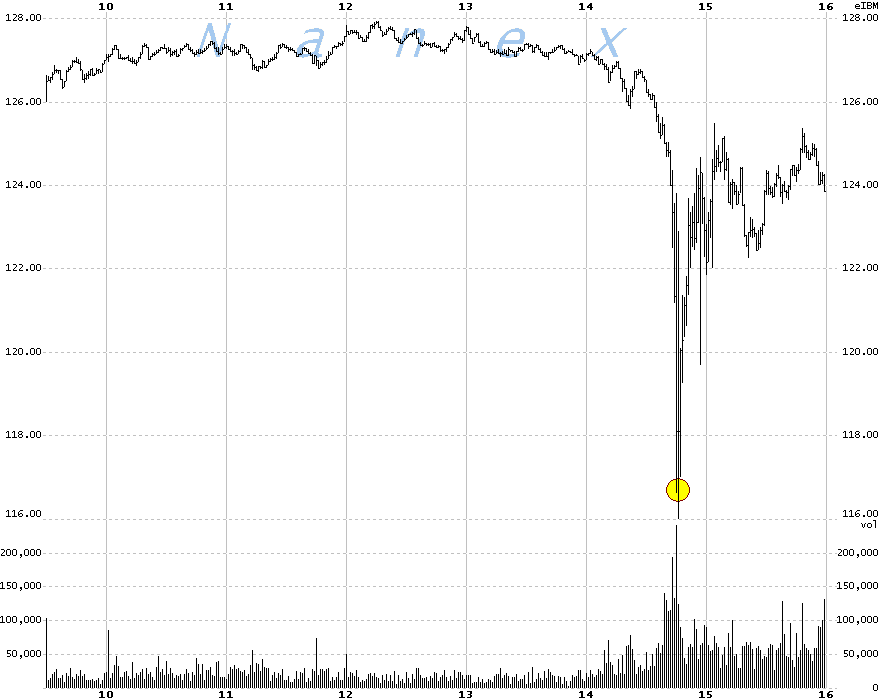
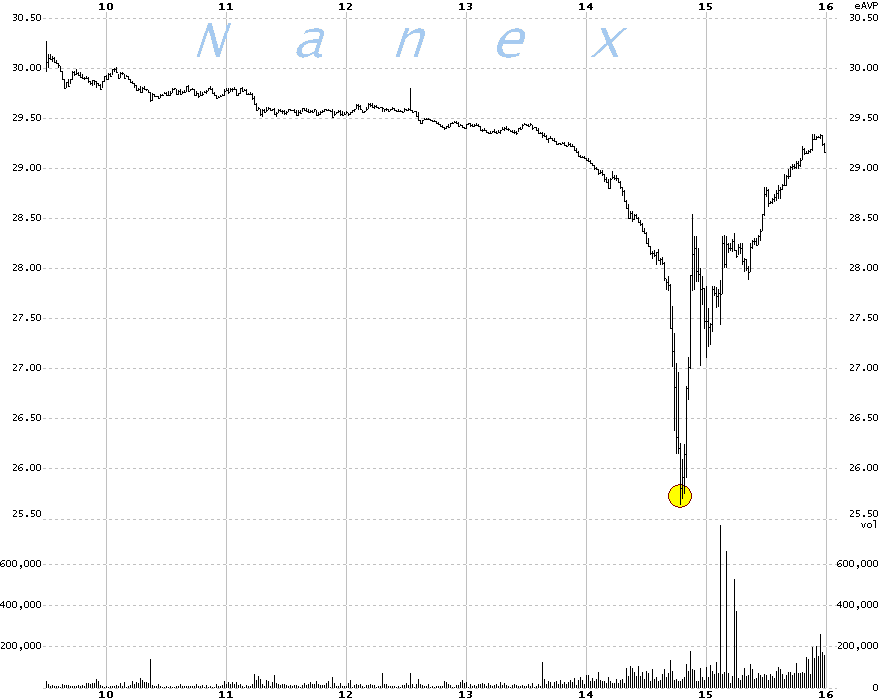
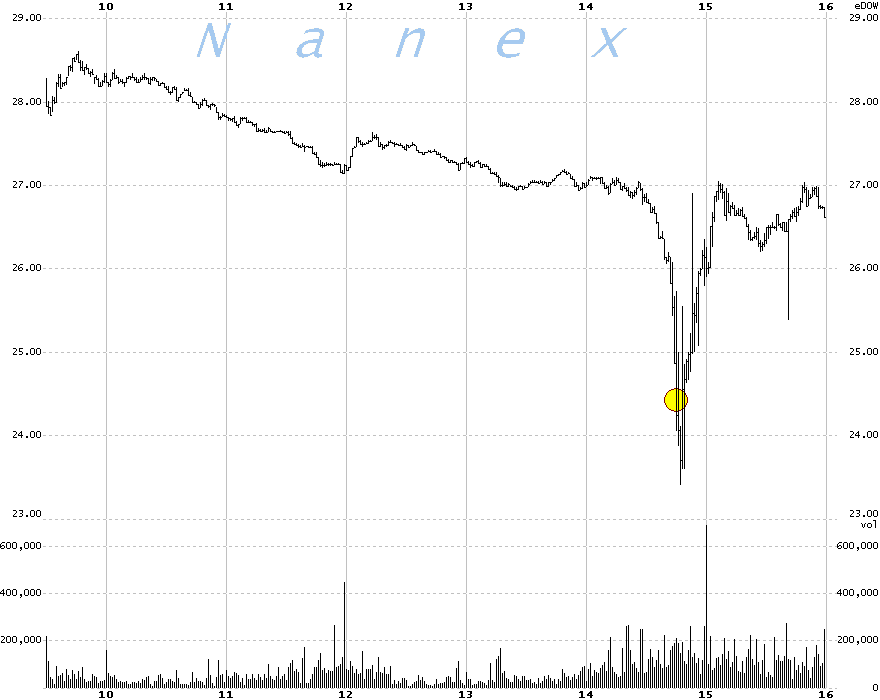
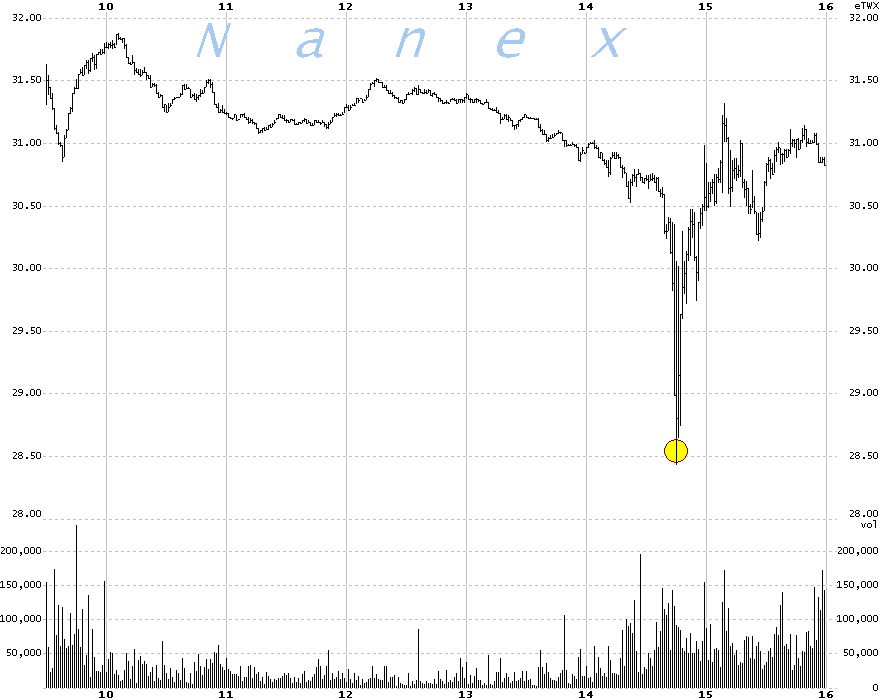
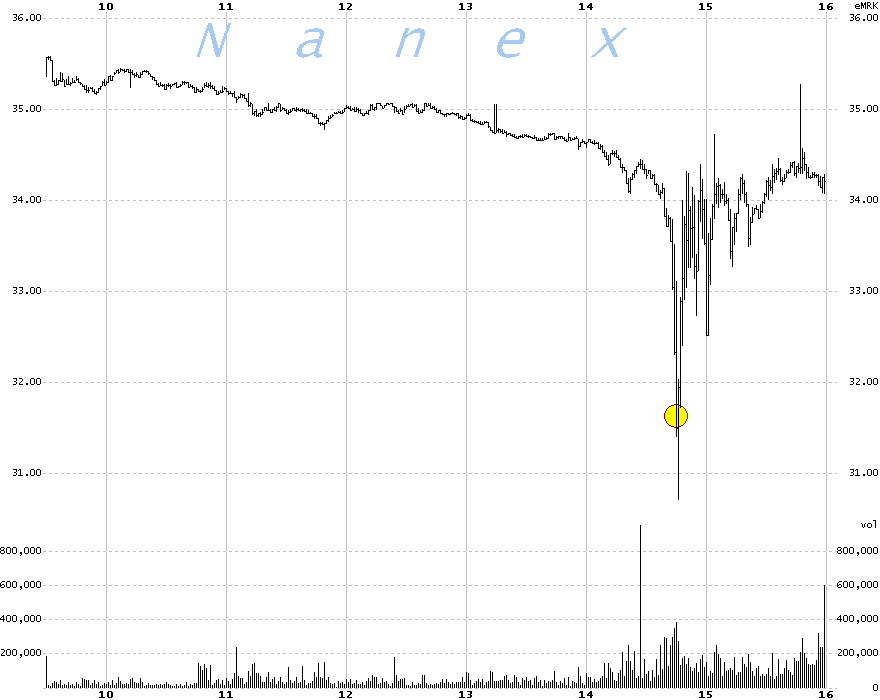
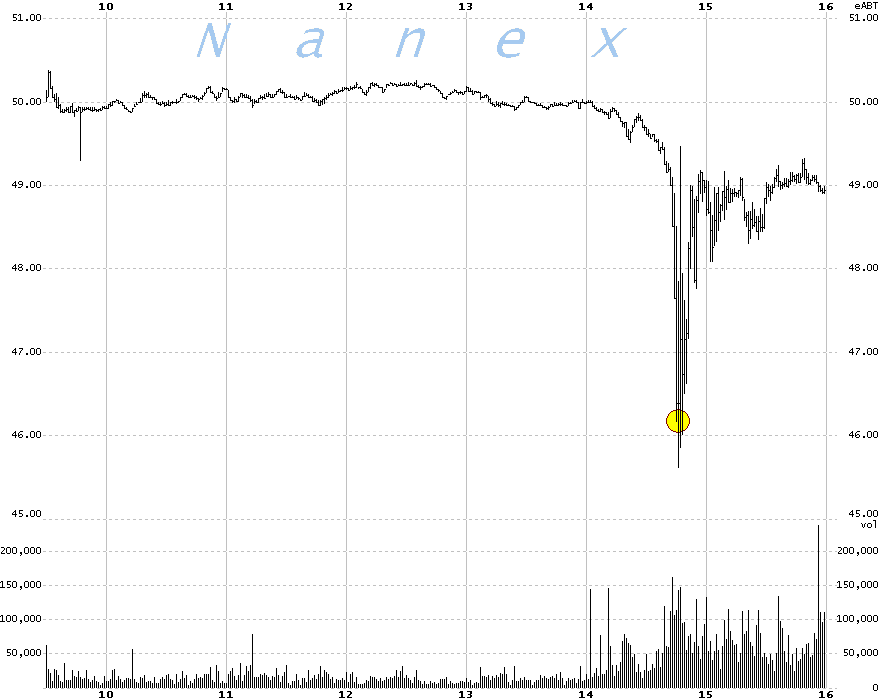
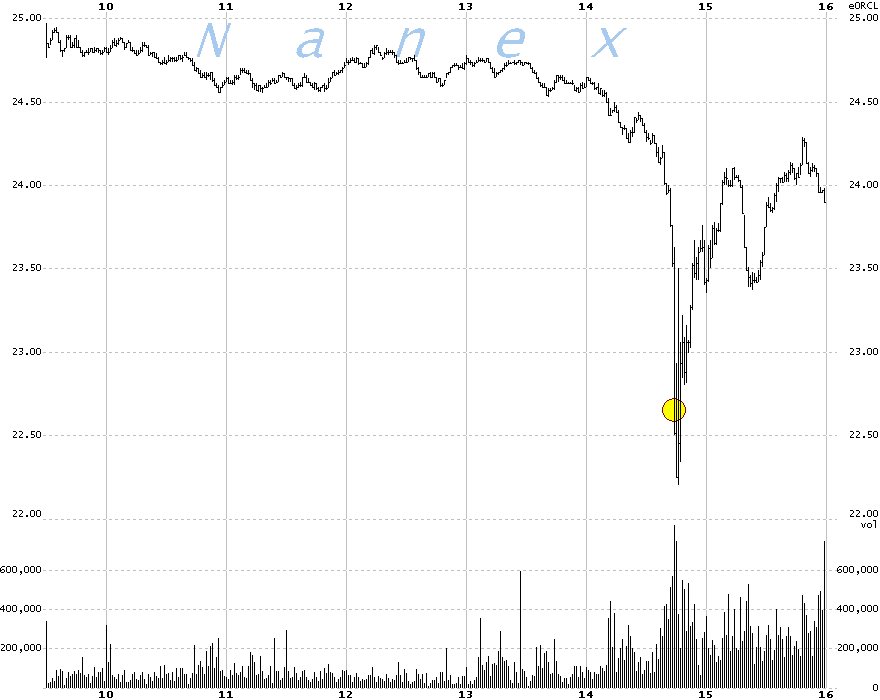
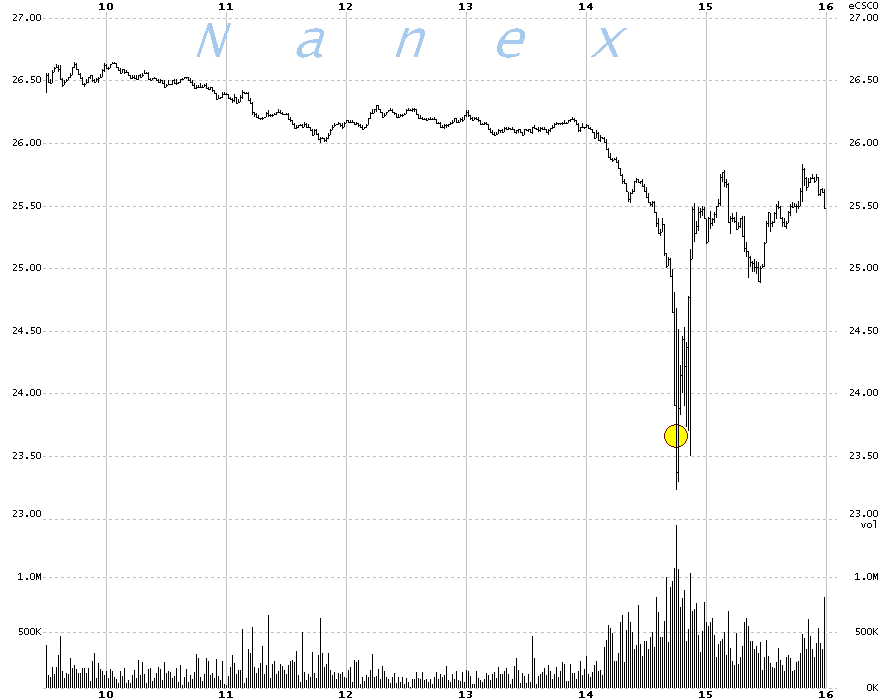
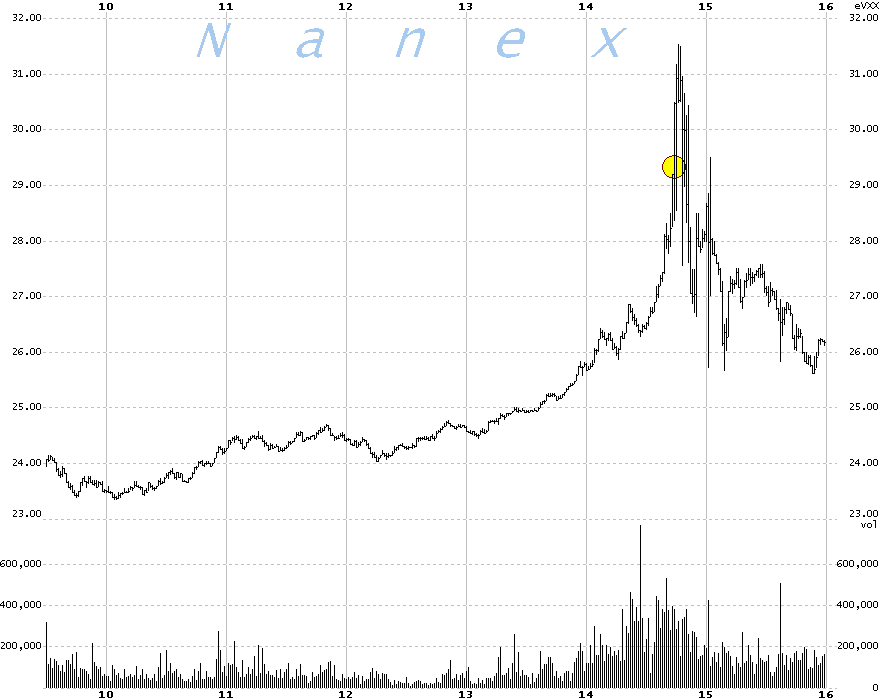
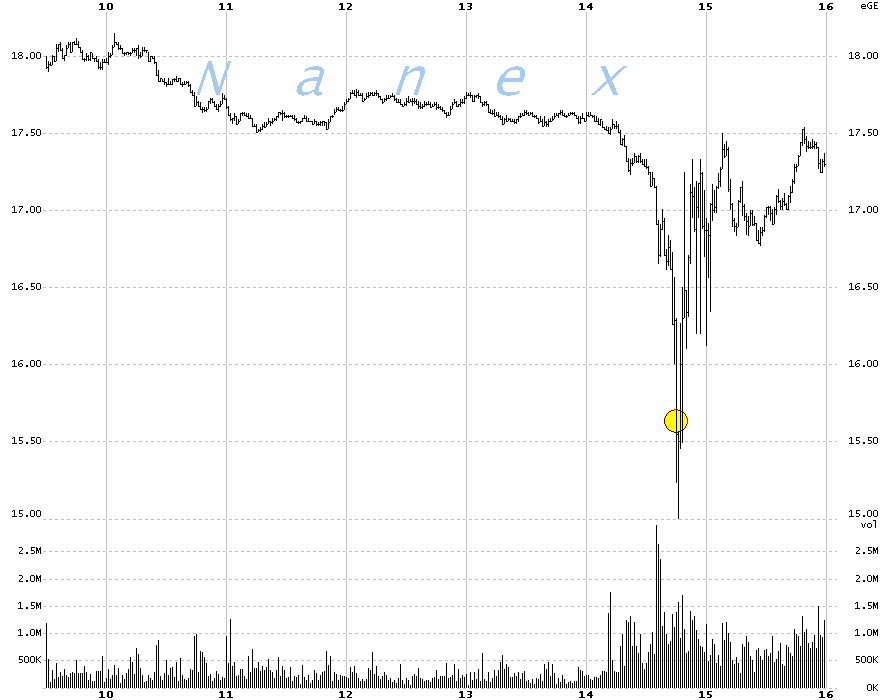
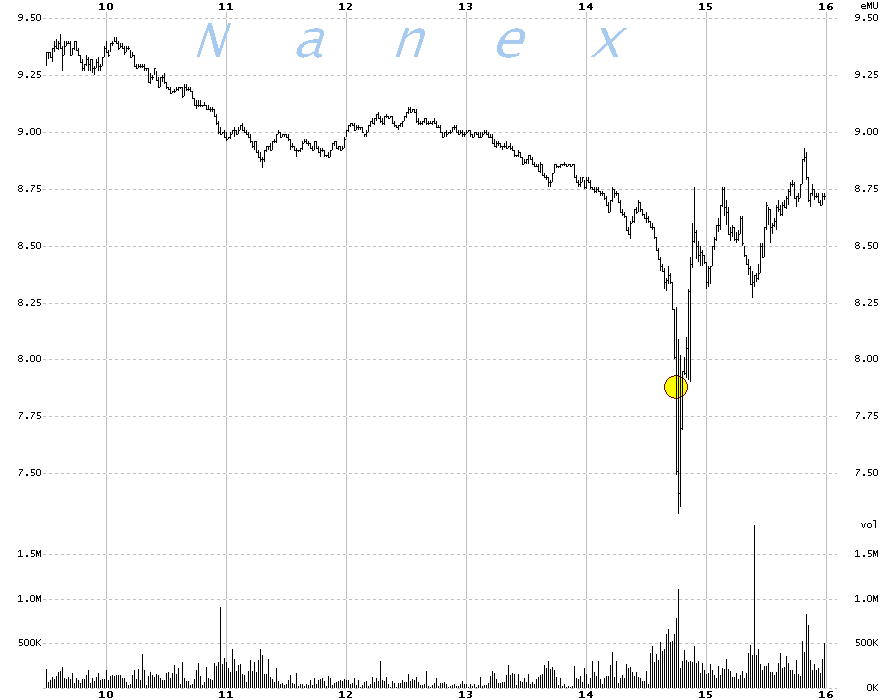
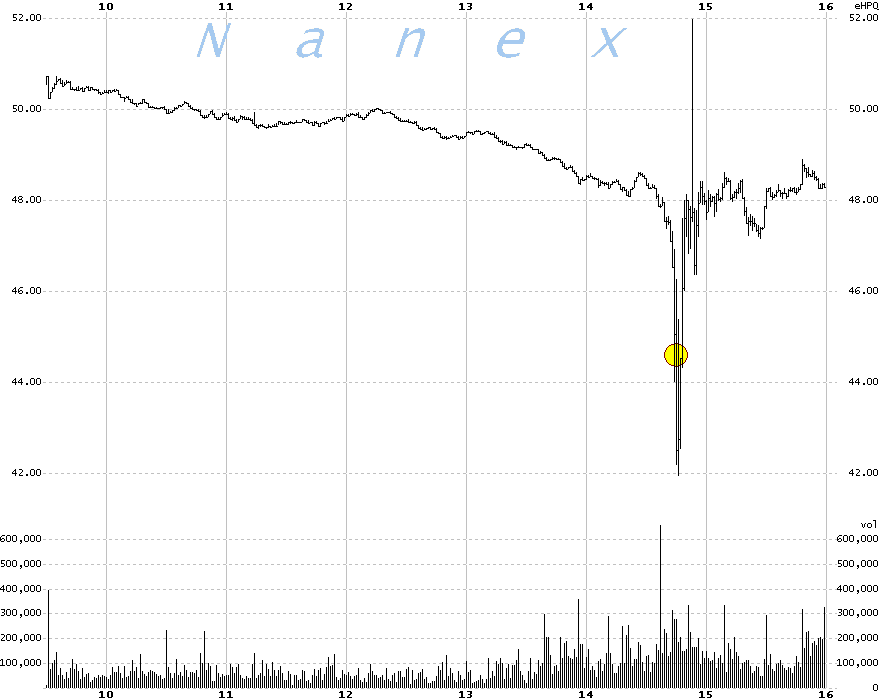
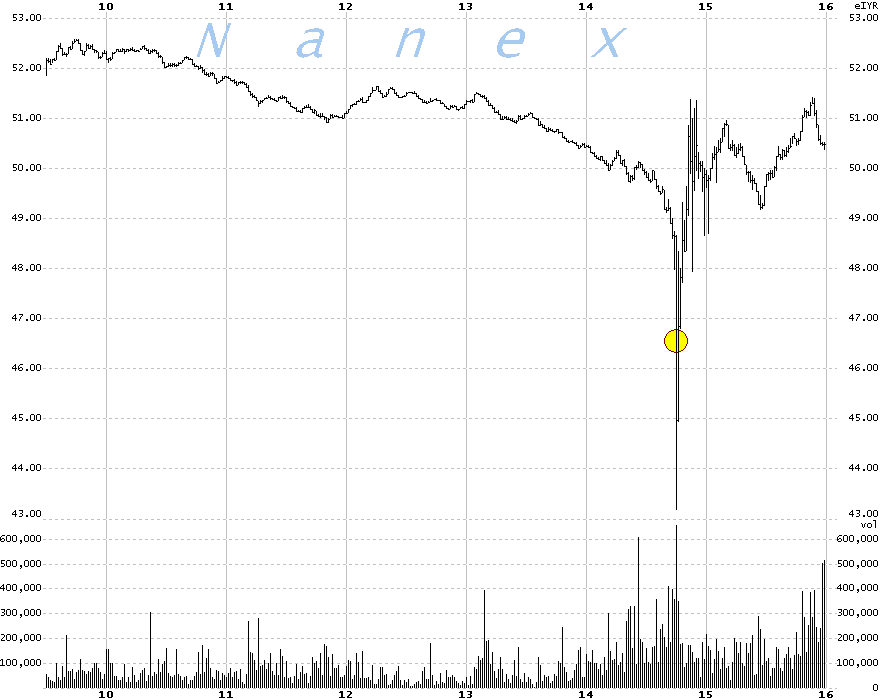
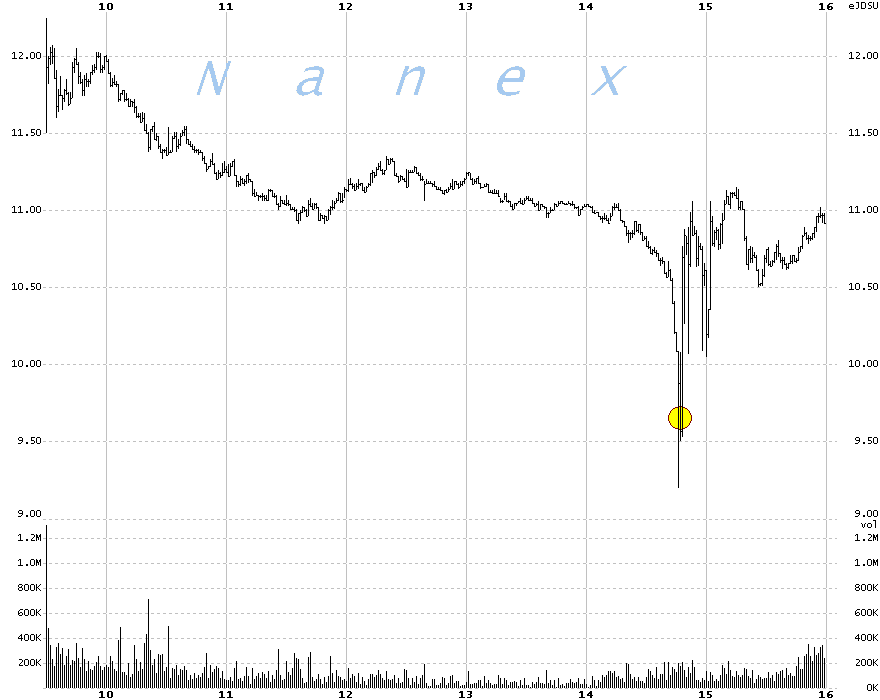
We present below, the charts of a few large capitalization, widely-held stocks that hit their simulated trading bands using data from May 6, 2010.
The circle shows the time and price where
the stock would have triggered a pause or halt if the plan
as it is written were in place on that day. All of these trigger points occur when
liquidity was near its lowest point, so it was highly likely that trading halts of
5 minutes or more would have frozen all these stocks at the point indicated by the
circle; allowing far more investors to experience the anxiety of the flash crash in
real time.
If you are interested in viewing all 350 chart images, please send us an email.
|
DIS - Walt Disney Company
IBM - International Business Machines
AVP - Avon Products
DOW - Dow Chemical Company
TWX - Time Warner, Inc.
MRK - Merck & Company, Inc
ABT - Abbott Laboratories
ORCL - Oracle Corp
CSCO - Cisco Systems, Inc.
VXX - iPath S&P 500 VIX Short Term Fund
GE - General Electric Company
MU - Micron Technologyy
HPQ - Hewlett-Packard Company
IYR - iShares Dow Jones U.S. Real Estate
JDSU - JDS Uniphase Corporation
|
Inquiries: pr@nanex.net
Publication Date: 08/02/2011
http://www.nanex.net
| This report and all material shown on this
website is published by Nanex, LLC and may not be reproduced, disseminated, or
distributed, in part or in whole, by any means, outside of the recipient's
organization without express written authorization from Nanex. It is a
violation of federal copyright law to reproduce all or part of this publication
or its contents by any means. This material does not constitute a solicitation
for the purchase or sale of any securities or investments. The opinions
expressed herein are based on publicly available information and are considered
reliable. However, Nanex makes NO WARRANTIES OR REPRESENTATIONS OF ANY SORT
with respect to this report. Any person using this material does so solely at
their own risk and Nanex and/or its employees shall be under no liability
whatsoever in any respect thereof. |
|
|
|


