Definition of a "Mini-Flash-Crash"
The AMJ Event of October 11, 2011
|
In the course of our research many reporters and industry professionals
have asked us to define what a "Mini-Flash-Crash" is. We cannot think
of a better explanation than the event shown below. Furthermore, while usage of
the term "Mini-Flash-Crash" is now
discouraged
by regulators, we also cannot think of a single term that better
describes the event.
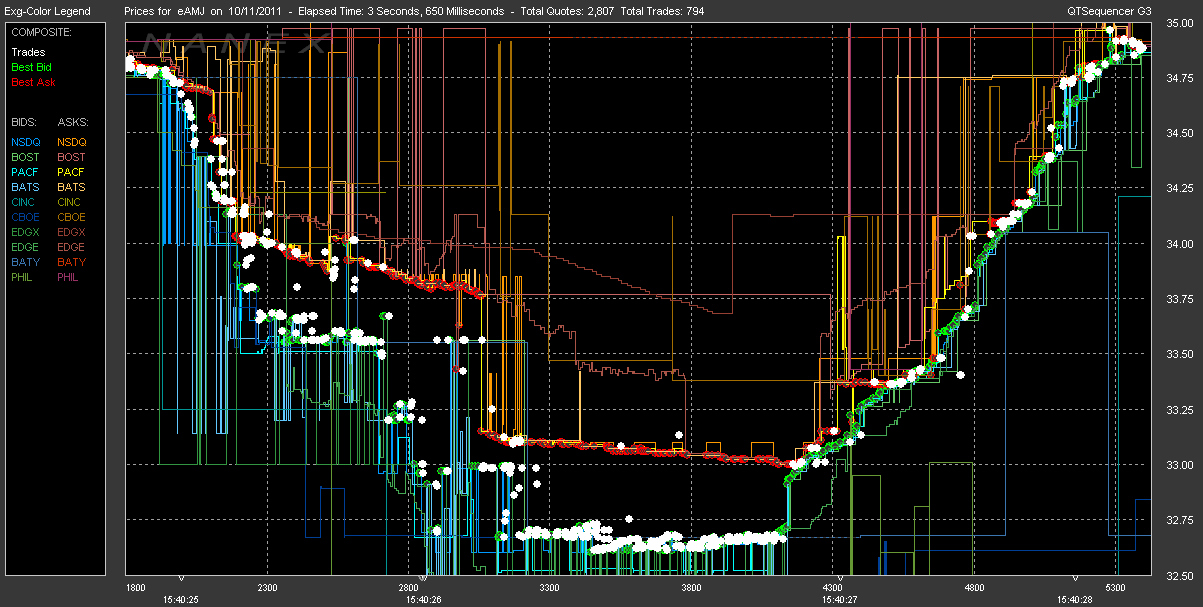
On October 11, 2011, the stock AMJ plummeted from $34.90 to $32.61 (a 6.5%
loss) and then recovered, all in just under 4 seconds. This was not an event
caused by news or a fat-finger error.
|
16:23:19 ET - NASDAQ MarketWatch is investigating potentially erroneous
transactions involving the security JPMorgan Alerian MLP Index ETN (AMJ)
executed between 15:40:00 and 15:41:00 ET today. MarketWatch will advise with
details as soon as available. Participants should review their trading activity
for potentially erroneous trades and request adjudication through the Clearly
Erroneous process within the applicable timeframe for filing pursuant to the
rule.
|
|
16:35:01 ET Pursuant to Rule 11890(b) NASDAQ, on its own motion, has
determined to cancel all trades in security JPMorgan Alerian MLP Index ETN
(AMJ) at or below $33.19 that were executed in NASDAQ between 15:40:00 and
15:41:00 ET. This decision cannot be appealed. MarketWatch has coordinated this
decision with other UTP Exchanges. NASDAQ will be canceling trades on the
participant’s behalf. |
|

Many proponents of HFT claim it dampens volatility,
such as this
research
paper which claims "Volatility is caused by panic behavior.
Computers don't panic, humans do". We feel confident in saying that during
this 4 second event, no human was involved. In the time it took you to read the
previous sentence, the event was over.
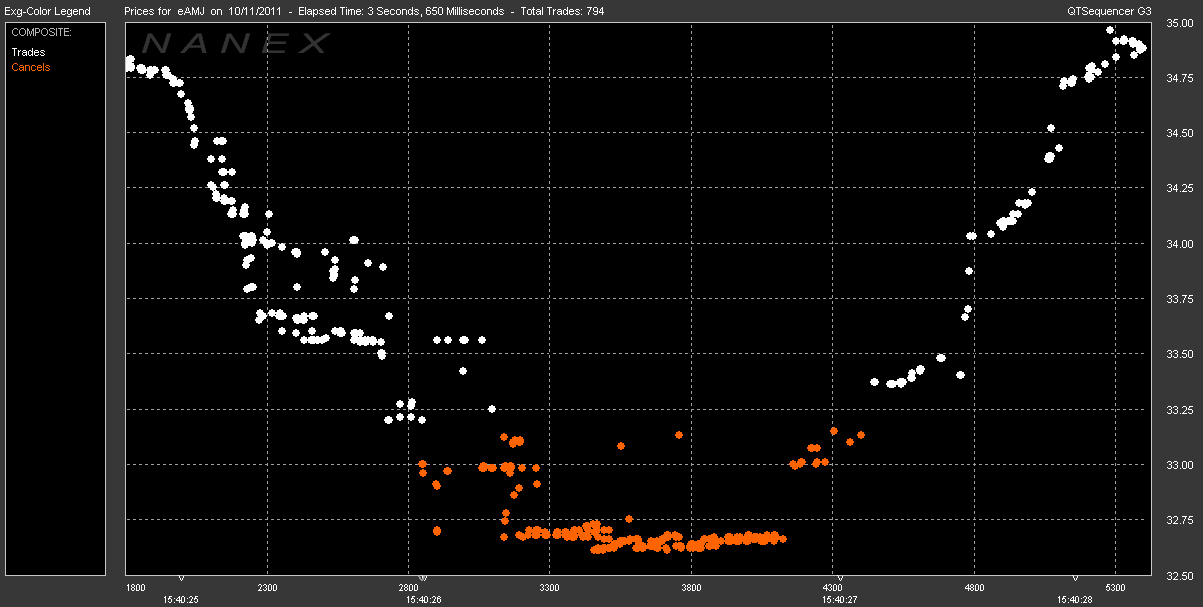
Was any investor harmed in this event? We think the answer is yes. Shown below
is a chart with only trades plotted (all quotes are removed). Trades that were
later canceled are plotted in orange, while trades that stuck are plotted in
white. While a large number of trades were indeed canceled (390 of 794 trades
were canceled to be exact), it is easy to see that many trades far away from
the trading price just 2 seconds prior stuck: |
 |
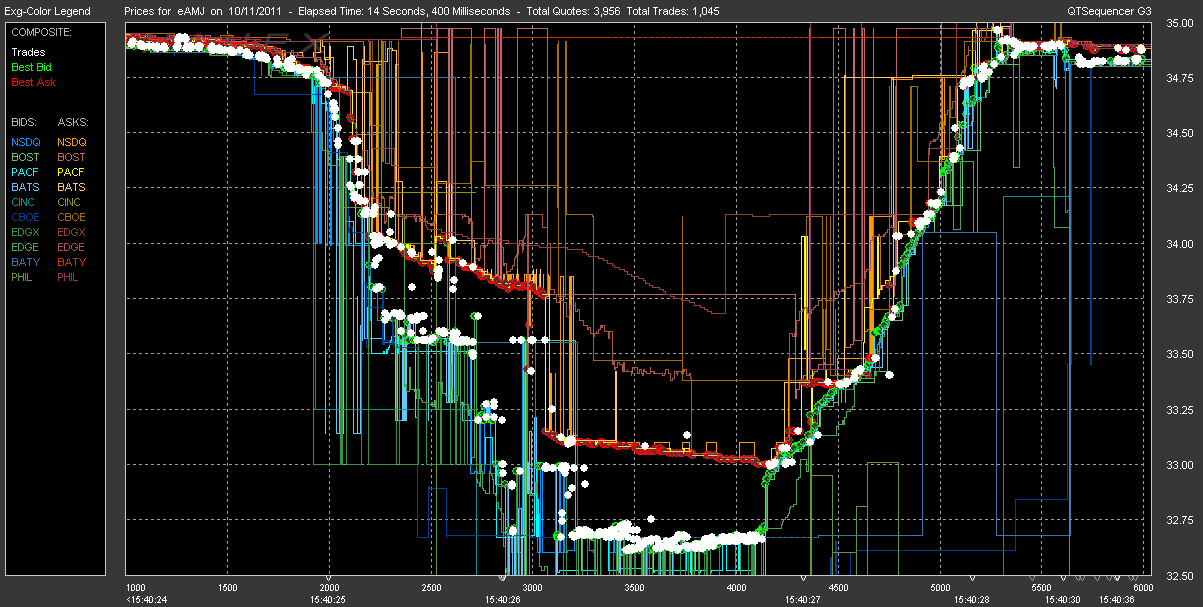
Finally we present a slightly longer term chart (approximately 14 seconds)
which gives a better perspective on how quick and suddent the move was:

|
Inquiries: pr@nanex.net
Publication Date: 10/12/2011
http://www.nanex.net
| This report and all material shown on this
website is published by Nanex, LLC and may not be reproduced, disseminated, or
distributed, in part or in whole, by any means, outside of the recipient's
organization without express written authorization from Nanex. It is a
violation of federal copyright law to reproduce all or part of this publication
or its contents by any means. This material does not constitute a solicitation
for the purchase or sale of any securities or investments. The opinions
expressed herein are based on publicly available information and are considered
reliable. However, Nanex makes NO WARRANTIES OR REPRESENTATIONS OF ANY SORT
with respect to this report. Any person using this material does so solely at
their own risk and Nanex and/or its employees shall be under no liability
whatsoever in any respect thereof. |
|
|
|


