Chicago's PMI News Release uncovers significant delays in
OPRA 06/30/2011
|
Back to
Table Of Contents
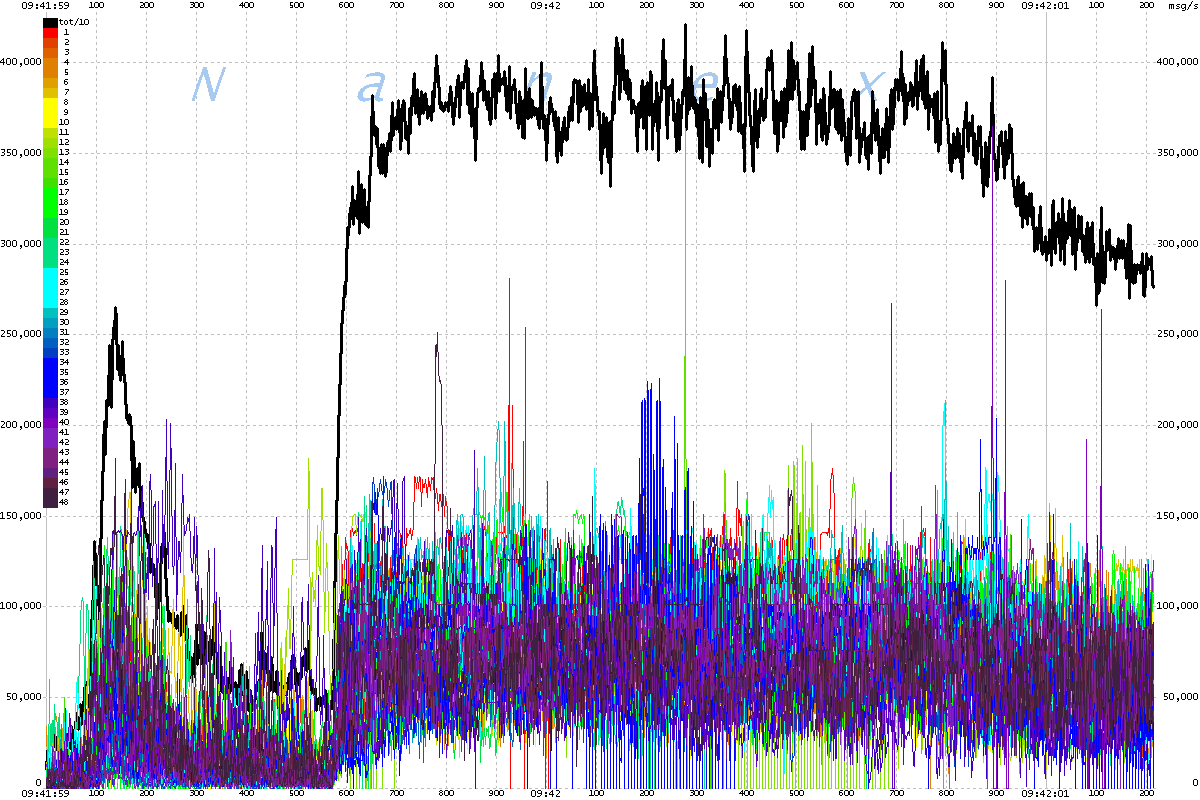
Approximately 1/2 second before the 9:42 release of the Chicago PMI report,
the option market exploded setting new records in quote rates, saturation, and
delays. We have not yet determined why the equity market did not see a record
explosion of quote traffic; rather it experienced the normal saturation/delay
that happens all too frequently every trading day.
The electronic S&P 500 futures experienced a withdrawal of liquidity
beginning about a minute before the release of the PMI number. At approximately
9:41:59.550, 1275 contracts cleared through 4 levels of the offer side of the
order book. This coincided with the explosion in OPRA quote traffic.
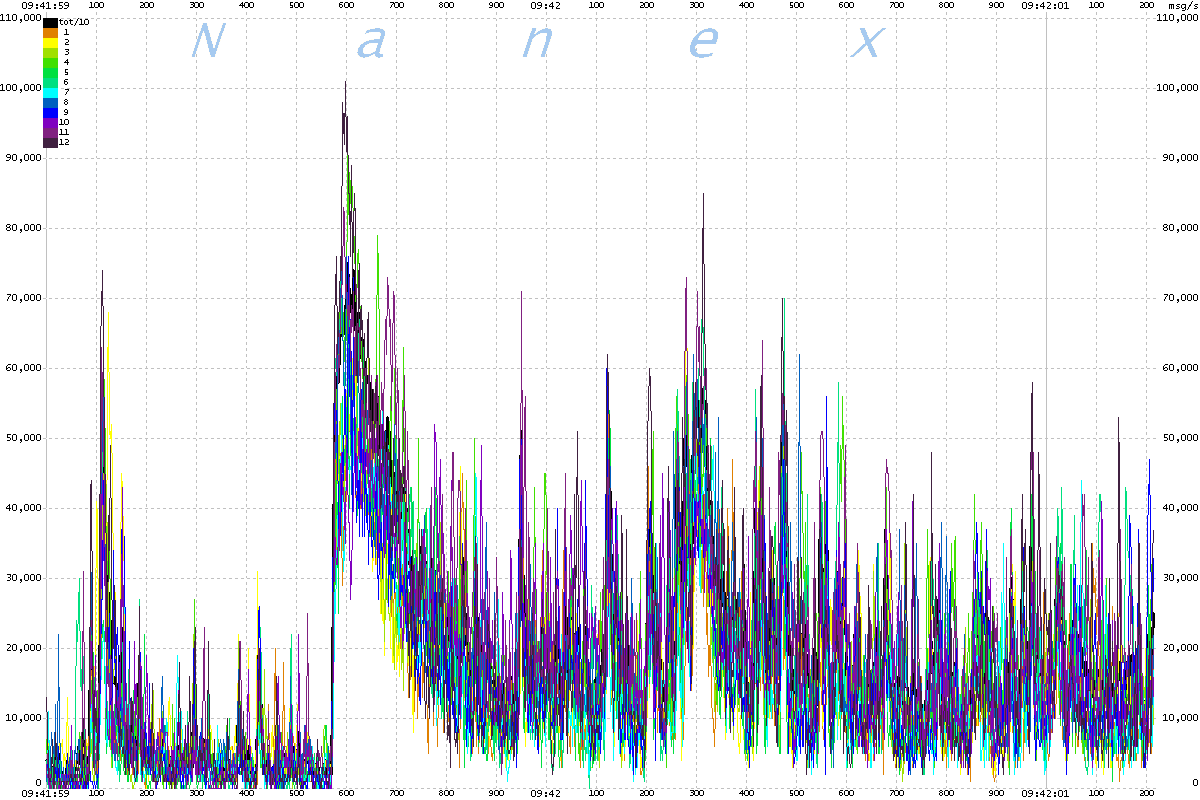
The first image shows quote message rates for each of the 12 CQS data lines
that carry data for NYSE, AMEX, and ARCA equities and ETFs in 2ms intervals.
Notice how quickly activity drops after the peak compared to the OPRA images
below it. Normally, options activity follows equity activity very closely. |

| The second image shows quote message rates for each of the 48 OPRA data
lines that carry quotes for all U.S. equity and index options. Note, we divided
the total by 10 to fit in the same scale, so for the total line, 400,000 is 4
million. |

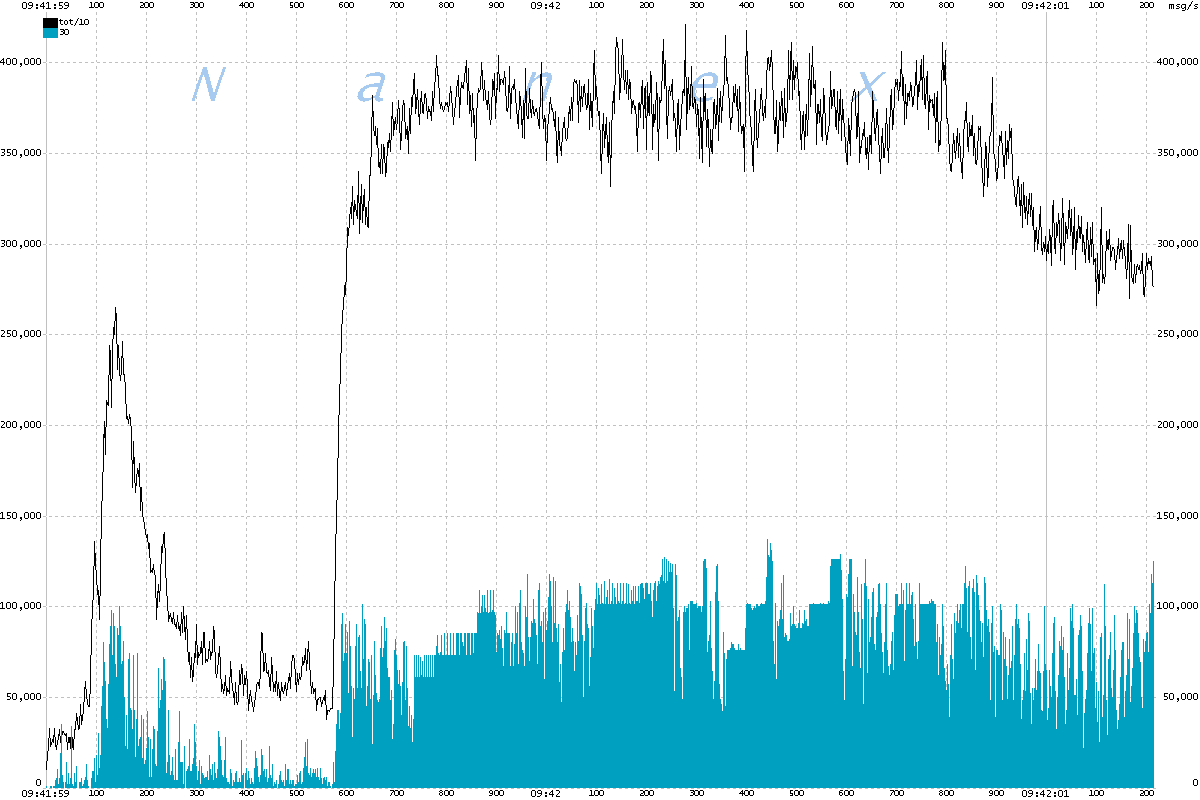
| The images that follow, show each of the 48 lines individually along with
the total, so that you can clearly see the saturation events and estimate the
duration and extent of the delay for each line. The flat-top areas you see on
the charts are caused by something gating, or queuing the data. Since OPRA,
like CQS, timestamps after data exits the queue -- right before it's
transmitted to subscribers -- it is impossible to know the exact duration of
these hidden delays, but 500ms to well over 1 full second is a conservative
estimate. We believe OPRA capacity would have to increase at least 3 times, to
12 million/second, in order to avoid these significant delays. However, at
those message rates, a significant number of quotes would have already expired
before they even left the exchange networks. |

| Several individual OPRA data lines show gaps which we believe are
exhaustion events. These quiet periods of no quotes are common, can last 20
milliseconds, and almost always follow a spike in activity. We have verified
that there were no drops in the data and that the charts accurately show the
quote traffic rates. Several lines, noteably #37, show a period of fluttering
between a high rate and zero which seem to appear during times of severe
saturation. |
| |
Inquiries: pr@nanex.net
Publication Date: 06/30/2011
http://www.nanex.net
| This report and all material shown on this
website is published by Nanex, LLC and may not be reproduced, disseminated, or
distributed, in part or in whole, by any means, outside of the recipient's
organization without express written authorization from Nanex. It is a
violation of federal copyright law to reproduce all or part of this publication
or its contents by any means. This material does not constitute a solicitation
for the purchase or sale of any securities or investments. The opinions
expressed herein are based on publicly available information and are considered
reliable. However, Nanex makes NO WARRANTIES OR REPRESENTATIONS OF ANY SORT
with respect to this report. Any person using this material does so solely at
their own risk and Nanex and/or its employees shall be under no liability
whatsoever in any respect thereof. |
|
|
|


