Usually when algorithms go haywire in the markets, they execute trades at
wild prices; many of which will later be canceled. 'Pretend it didn't
happen' is the current mantra of our regulatory agencies. The regulators
would also appreciate it if you
didn't talk about these events as they could harm
investor confidence. What country are we in?
Until firms are held responsible for their actions or the actions of their
technology, the haywire algo's (and the companies that deploy them) are free to
do it again and again.
Presented below are three examples. You won't find these trades in most
databases any longer, they have already been scrubbed (they didn't happen).
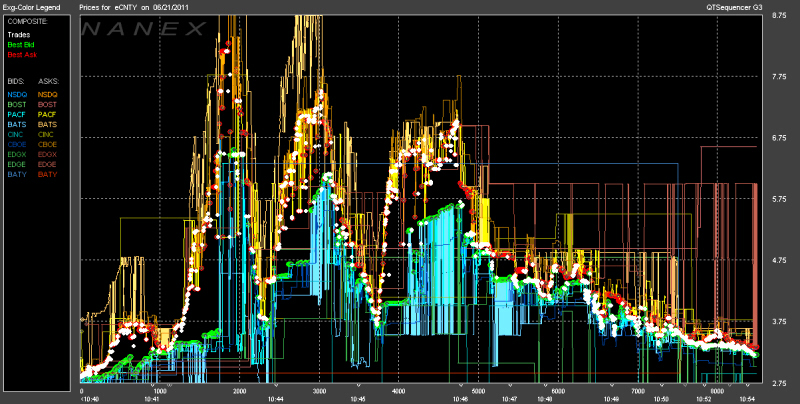
The following chart plots quotes and trades of the stock
CNTY on
06/21/2011. The stock cycled violently from approximately $2.75 to
$8.00 several times:
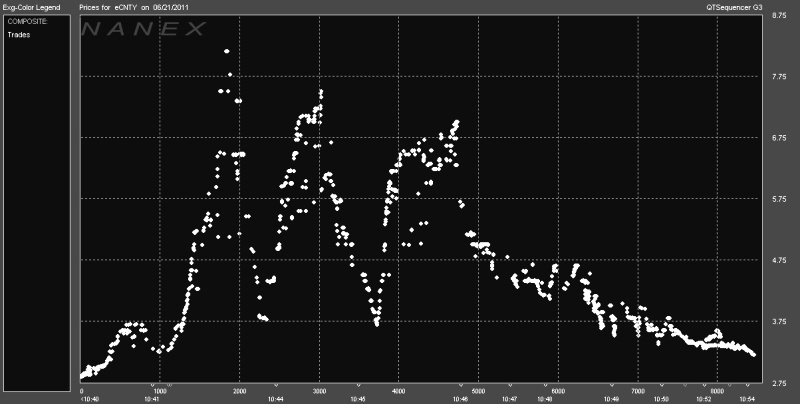
In this chart we have removed all quotes and plotted only trades:
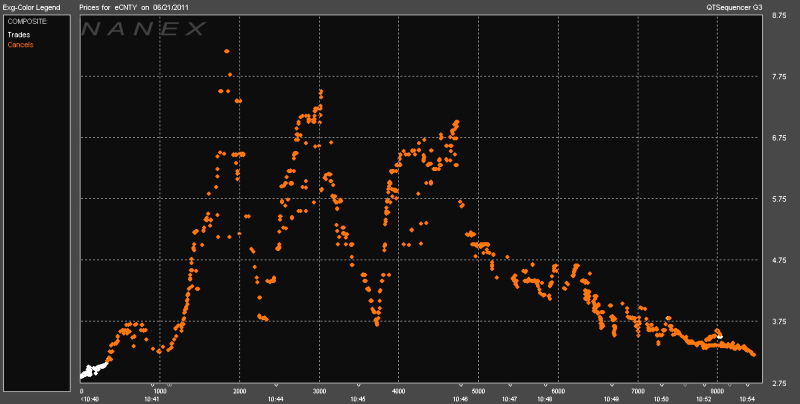
In this chart we color the canceled trades orange:
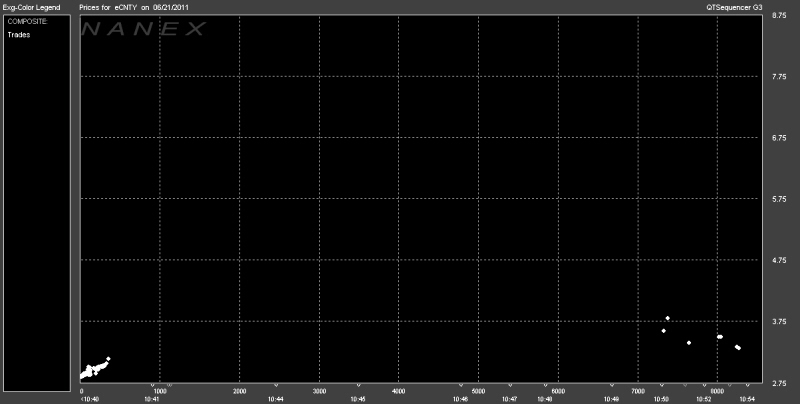
Finally, the next chart shows the trades with the now canceled trades absent.
"Nothing Happened", just another Algo In The Mist.
In the next example we show the stock
ACOR on
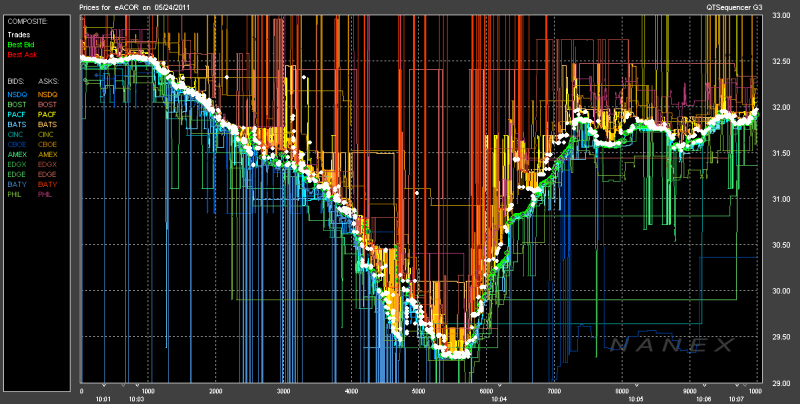
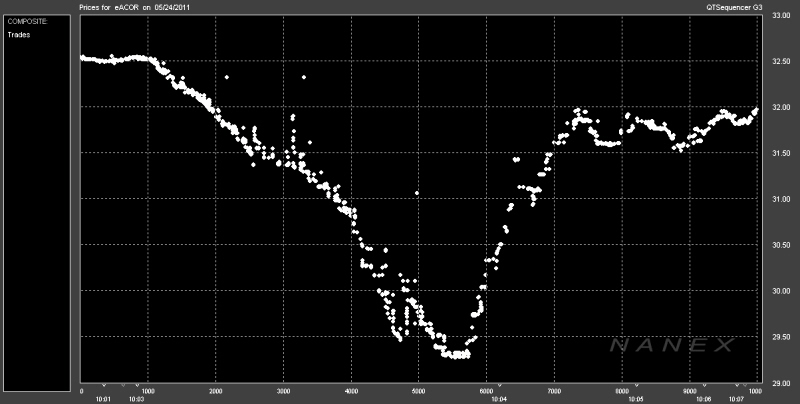
05/24/2011. The stock lost approximately 11% of it's value in under 5
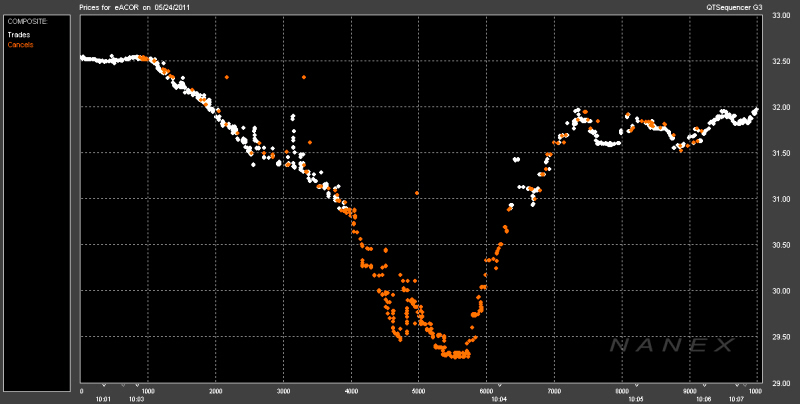
seconds then quickly recovered. While many of these trades got canceled, it's
easy to see a few traders still got burned. Unfortunately, this trend will only
continue if algos are allowed to conduct bad business that simply gets swept
under the rug.
The following chart plots quotes and trades of the stock ACOR on
05/24/2011:
In this chart we have removed all quotes and plotted only trades:
In this chart we color the canceled trades orange:
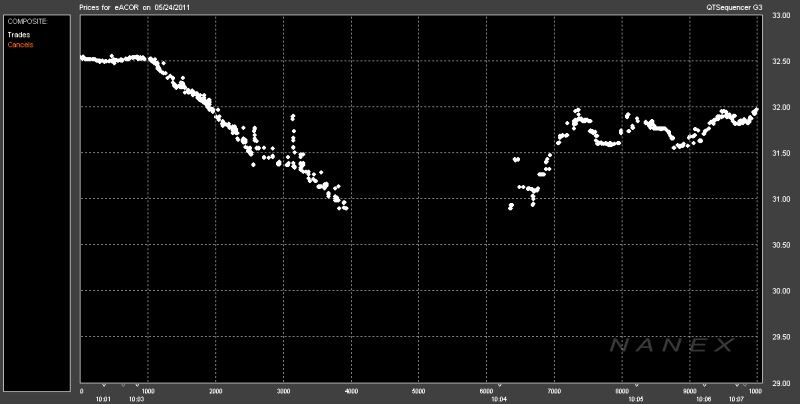
Finally, the next chart shows the trades with the now canceled trades absent.
Once again the regulatory agencies cancel the trades, close their eyes and
pretend it never happened.
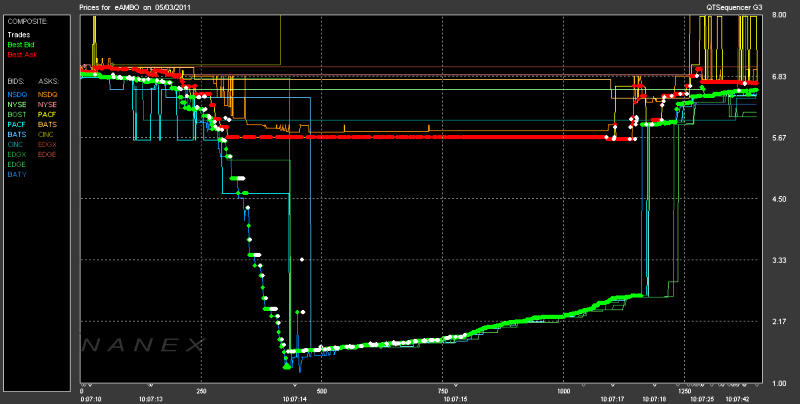
In the next example we show the stock
AMBO on
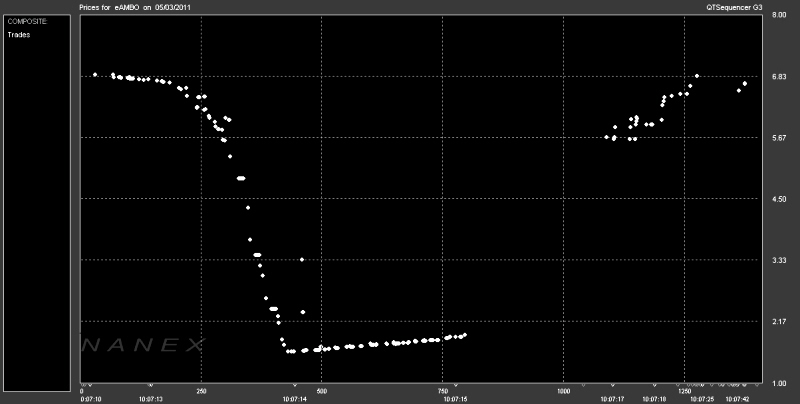
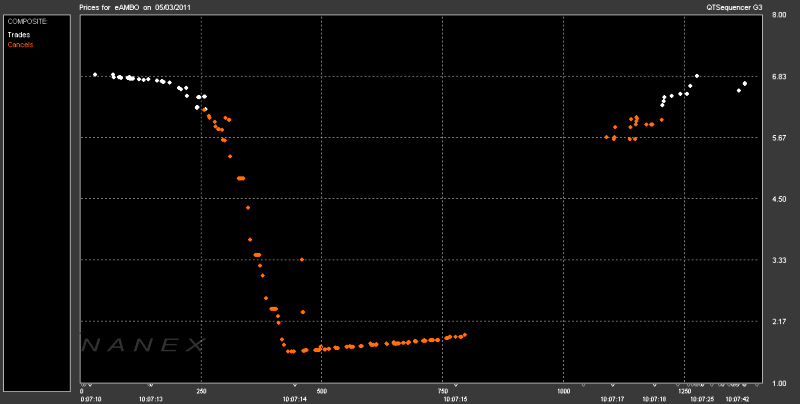
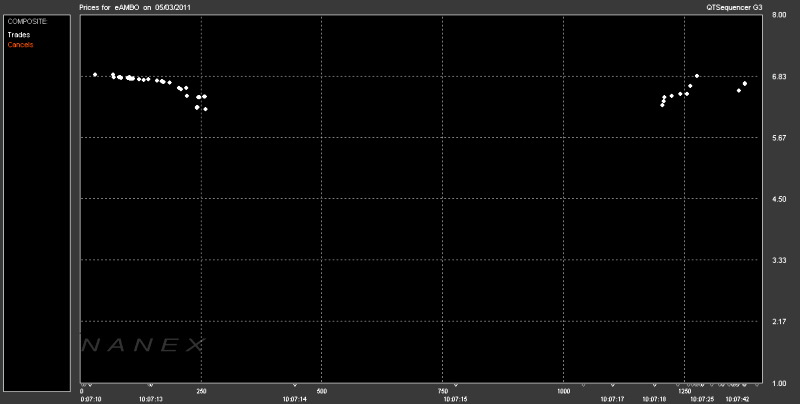
05/03/2011. Shares fell from $6.74 to $1.59 within a single second:
The following chart plots quotes and trades of the stock AMBO on
05/03/2011:
In this chart we have removed all quotes and plotted only trades:
In this chart we color the canceled trades orange:
Finally, the next chart shows the trades with the now canceled trades
absent.
|
|
Inquiries: pr@nanex.net
Publication Date: 09/28/2011
http://www.nanex.net
| This report and all material shown on this
website is published by Nanex, LLC and may not be reproduced, disseminated, or
distributed, in part or in whole, by any means, outside of the recipient's
organization without express written authorization from Nanex. It is a
violation of federal copyright law to reproduce all or part of this publication
or its contents by any means. This material does not constitute a solicitation
for the purchase or sale of any securities or investments. The opinions
expressed herein are based on publicly available information and are considered
reliable. However, Nanex makes NO WARRANTIES OR REPRESENTATIONS OF ANY SORT
with respect to this report. Any person using this material does so solely at
their own risk and Nanex and/or its employees shall be under no liability
whatsoever in any respect thereof. |
|
|


