Strange Days June 8'th, 2011 - NatGas Algo
|
Back to
Table Of Contents
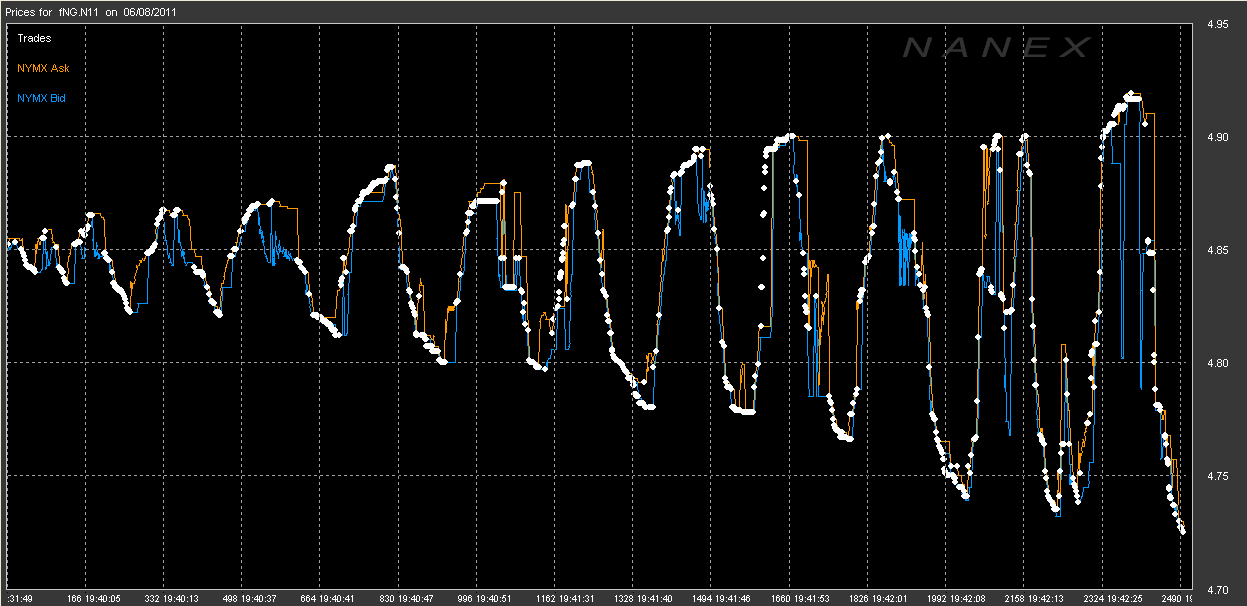
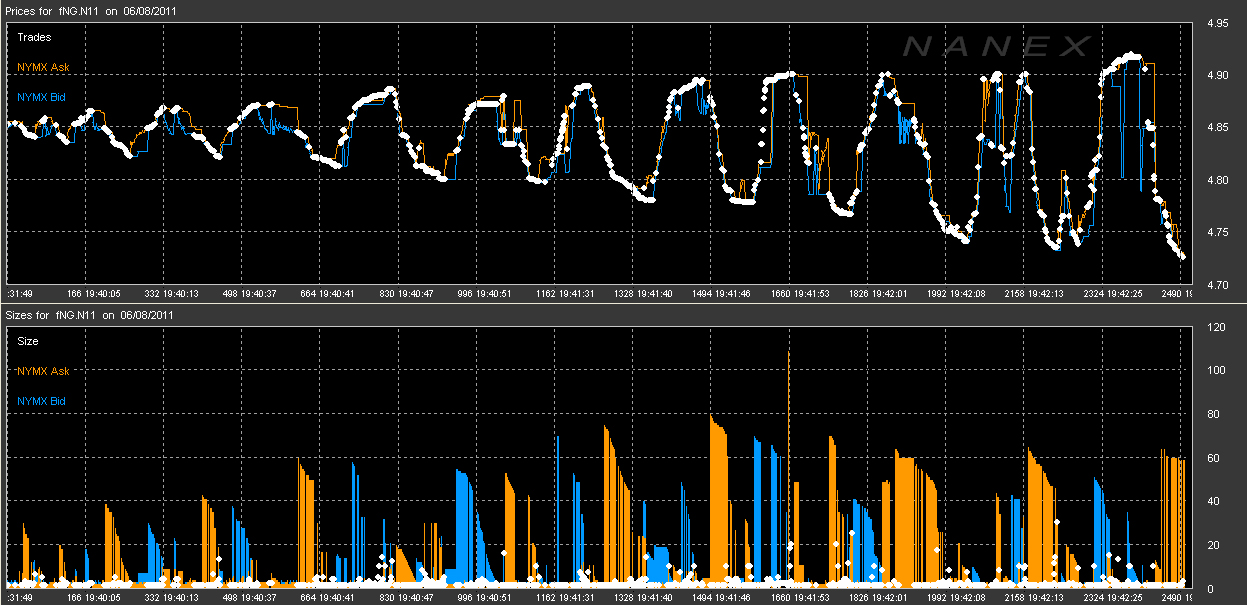
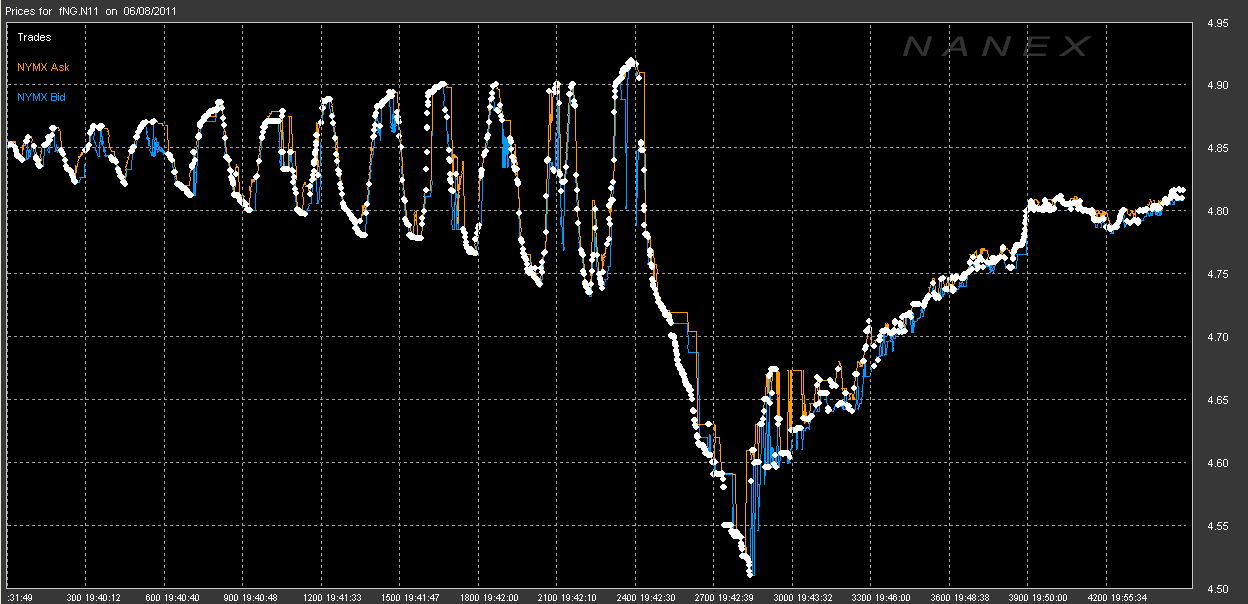
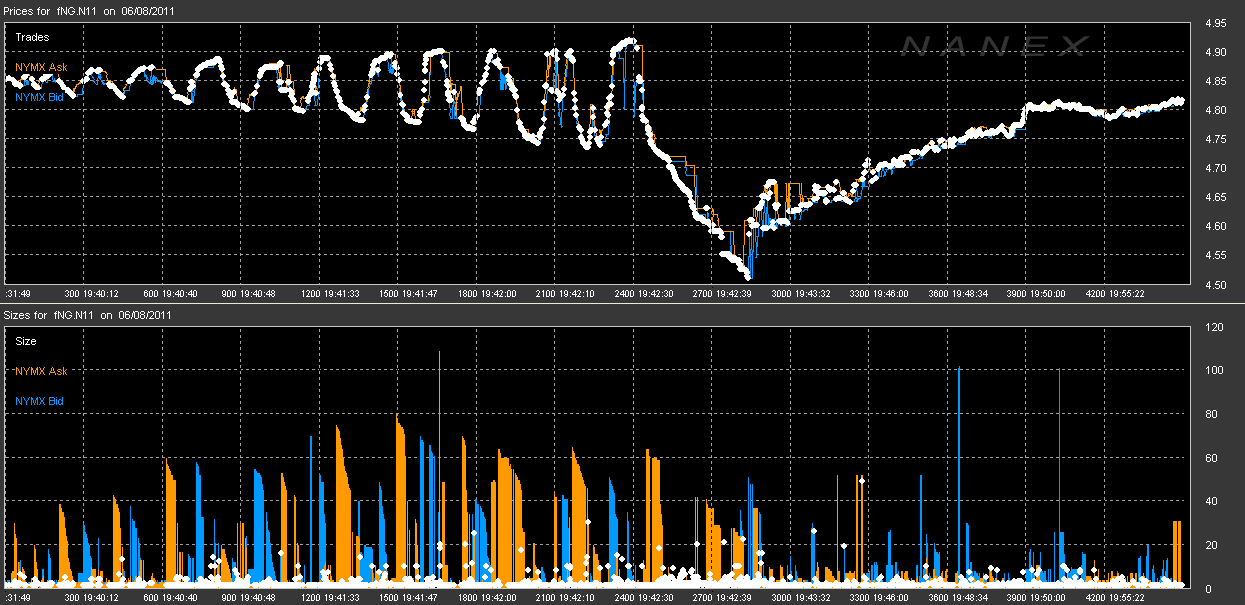
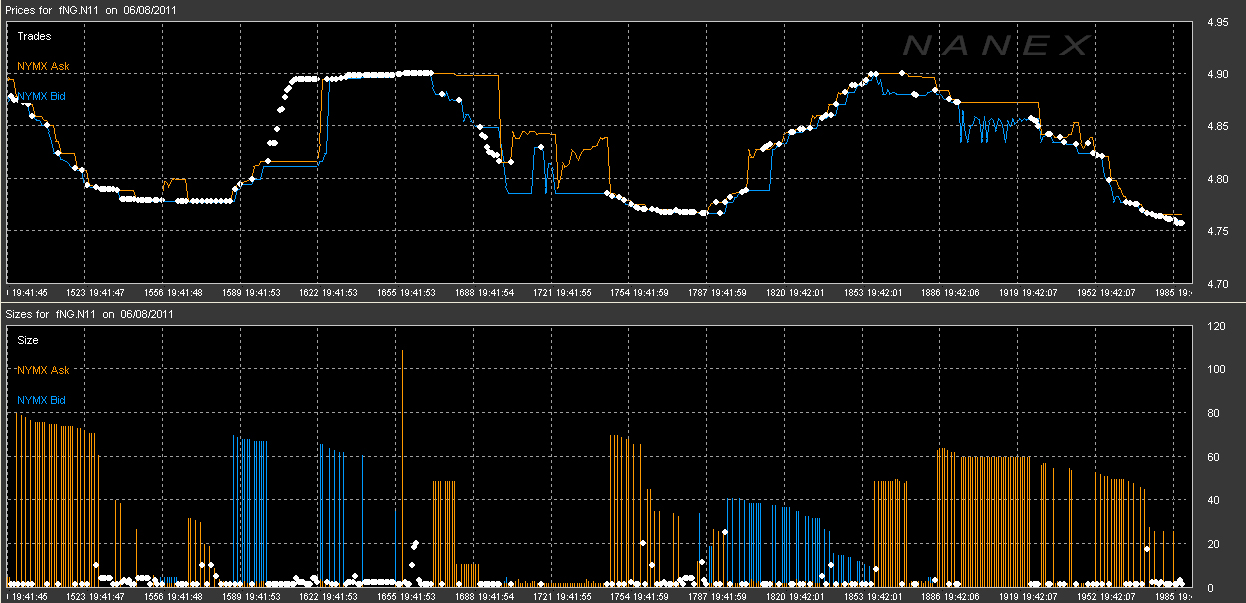
In the following chart, trades and quotes are plotted sequentially as they
occur. As such, no data is lost. Exchange's bid and ask prices are colored
according to the legend on the left. Trades are colored in white.
Activity before the drop, prices only:
Activity before the drop, prices and size:
Activity after the drop, prices only:
Activity after the drop, prices and size:
Zoom in of the pattern:
The following charts show trade, trade volume, and depth of book prices and
relative sizes for the July 2011 Natural Gas futures trading on NYMEX. Depth of
book data is color coded by color of the rainbow (ROYGBIV), with red
representing high bid/ask size and violet representing low bid/ask size. In
this way, we can easily see changes in size to the depth of the trading book
for this contract.
Depth of book is 10 levels of bid prices and 10 levels of ask prices. The bid
levels start with the best (highest) bid, and drop in price 10 levels. Ask
levels start with the best (lowest) ask, and increase in price 10 levels. The
different in price between levels is not always the same. It depends on traders
submitting bids and offers. In other words, depth of book shows the 10 best bid
prices, and 10 best ask prices.
In a normal market, prices move lower when the number of contracts at the top
level bid are executed. The next highest bid level then becomes the top level,
and the 3rd level becomes the second and so forth. A new level is then added
below the previous lowest level. On our our depth charts display, you would see
this behavior as a change in color of the top level bid from the red end of the
spectrum towards the violet end.
On June 8, 2011, starting at 19:39 Eastern Time, trade prices began oscillating
almost harmonically along with the depth of book. However, prices rose as bid
were executed, and prices declined when offers were executed -- the exact
opposite of a market based on supply and demand. Notice that when the prices go
up, the color on the ask side remains mostly unchanged, but the color on the
bid side goes from red to violet. When prices go down, the color on the bid
side remains mostly unchanged, but the color on the ask side goes from red to
violet. This is highly unusual.
Upon closer inspection, we find that price oscillates from low to high when
trades are executing against the highest bid price level. After reaching a
peak, prices then move down as trades execute against the highest ask price
level. This is completely opposite of normal market behavior.
The amplitude (difference between the highest price and lowest price) of each
oscillation slowly increases, until a final violent downward swing on high
volume. There also appears to be 3 groups of these oscillations or perhaps two
intervals separating these oscillations. It's almost as if someone is executing
a new algorithm that has it's buying/selling signals crossed. Most disturbing
to us is the high volume violent sell off that affects not only the natural gas
market, but all the other trading instruments related to it. |


|
Inquiries: pr@nanex.net
Publication Date: 06/08/2011
http://www.nanex.net
| This report and all material shown on this
website is published by Nanex, LLC and may not be reproduced, disseminated, or
distributed, in part or in whole, by any means, outside of the recipient's
organization without express written authorization from Nanex. It is a
violation of federal copyright law to reproduce all or part of this publication
or its contents by any means. This material does not constitute a solicitation
for the purchase or sale of any securities or investments. The opinions
expressed herein are based on publicly available information and are considered
reliable. However, Nanex makes NO WARRANTIES OR REPRESENTATIONS OF ANY SORT
with respect to this report. Any person using this material does so solely at
their own risk and Nanex and/or its employees shall be under no liability
whatsoever in any respect thereof. |
|
|
|


