Strange Days July 14'th, 2011 - TLT
|
Back to
Table Of Contents
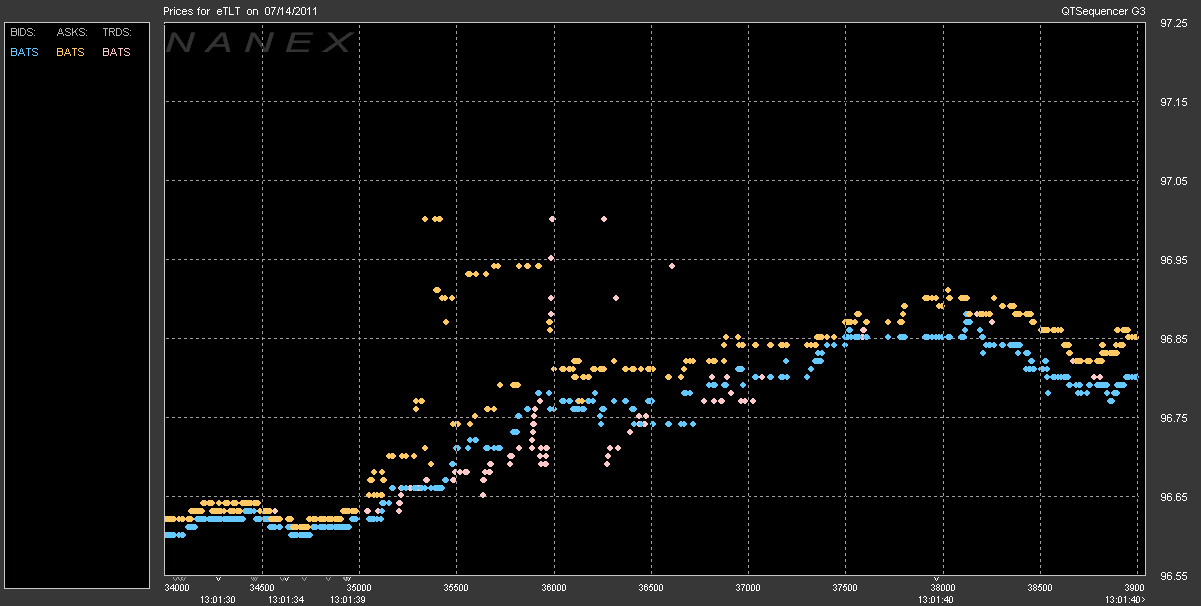
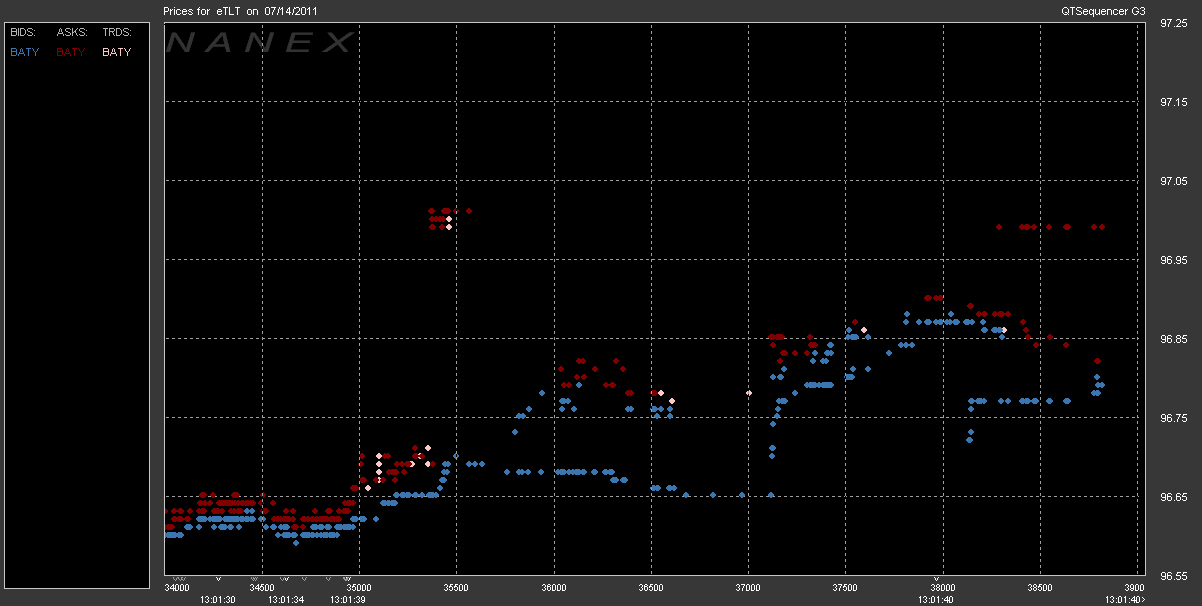
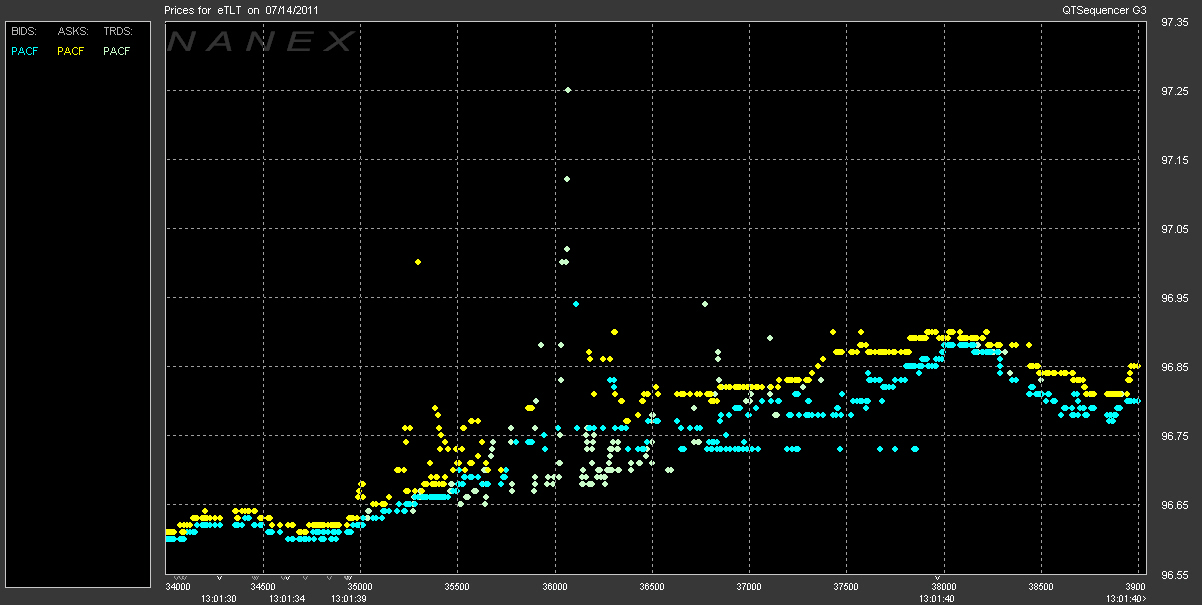
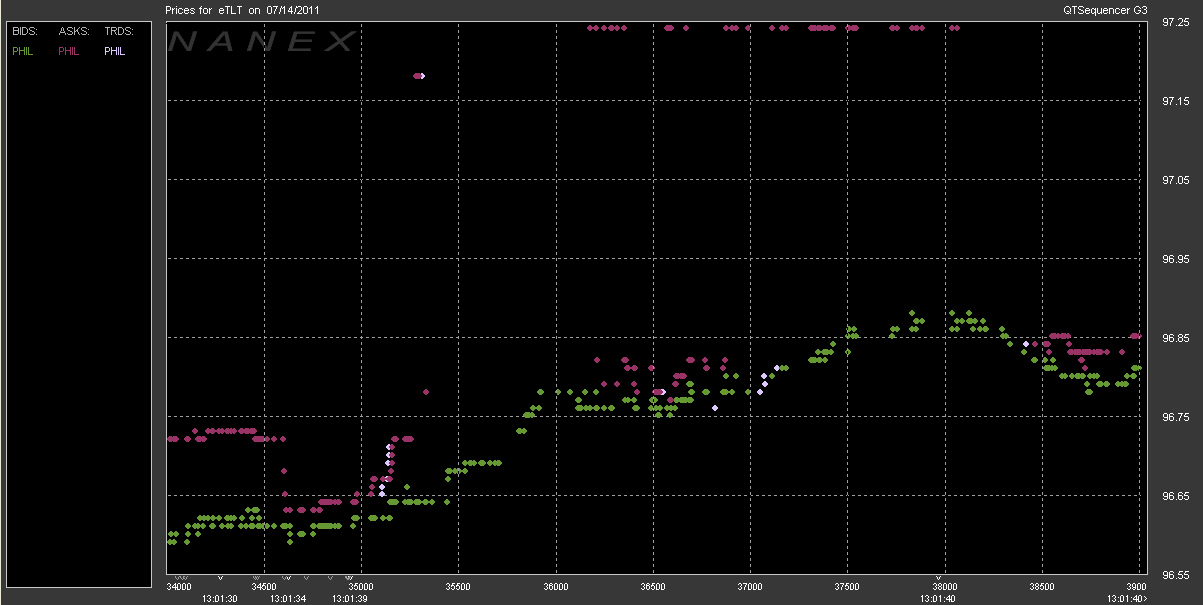
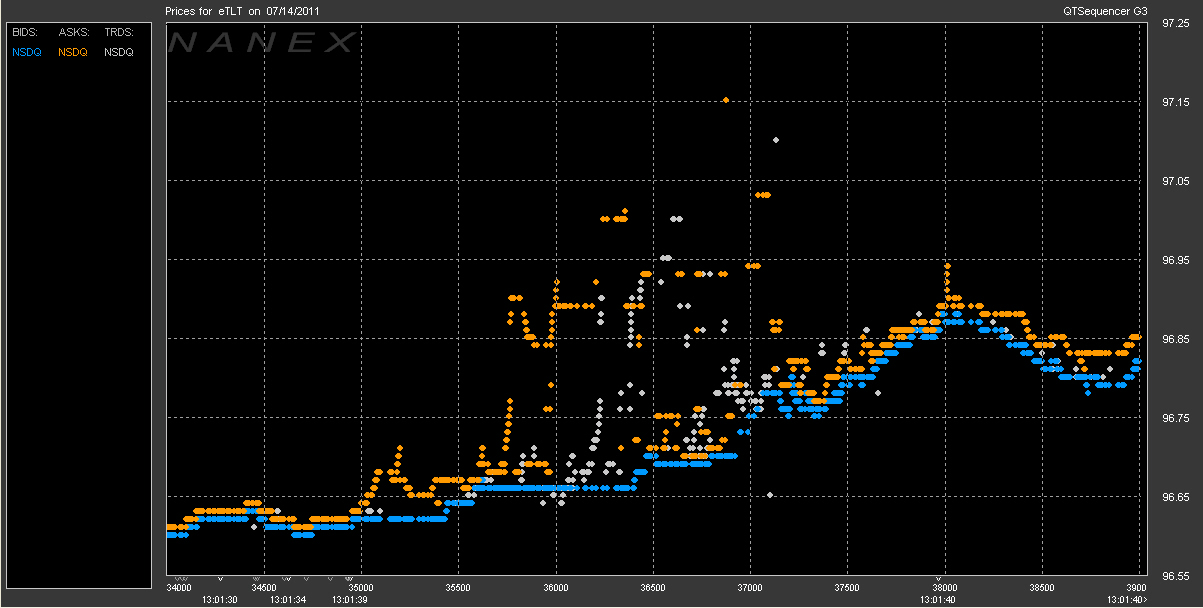
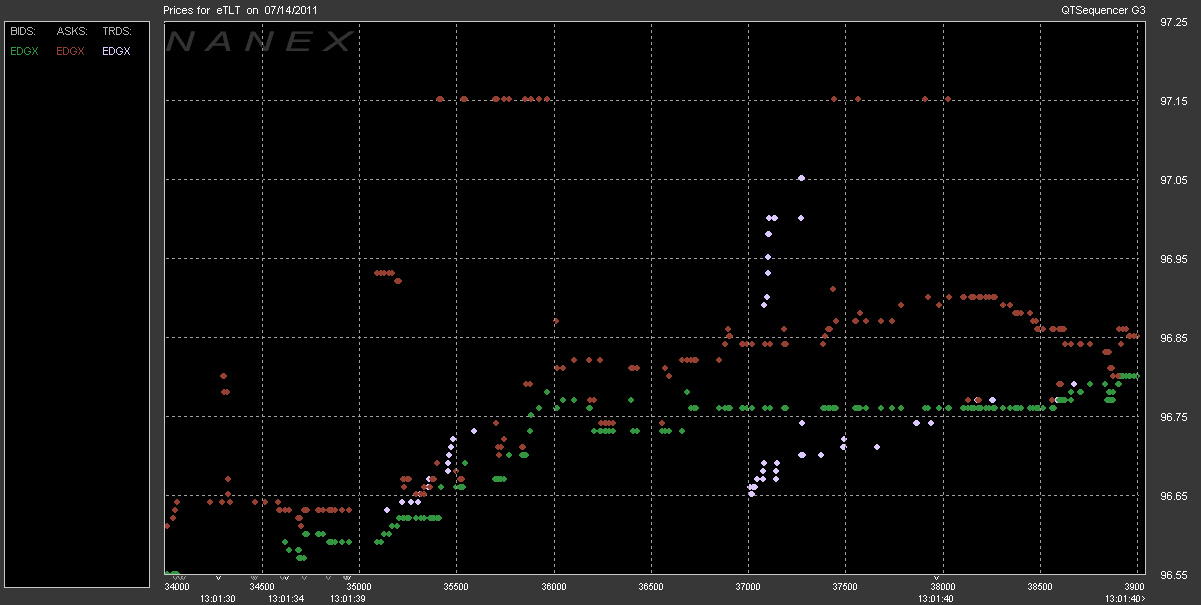
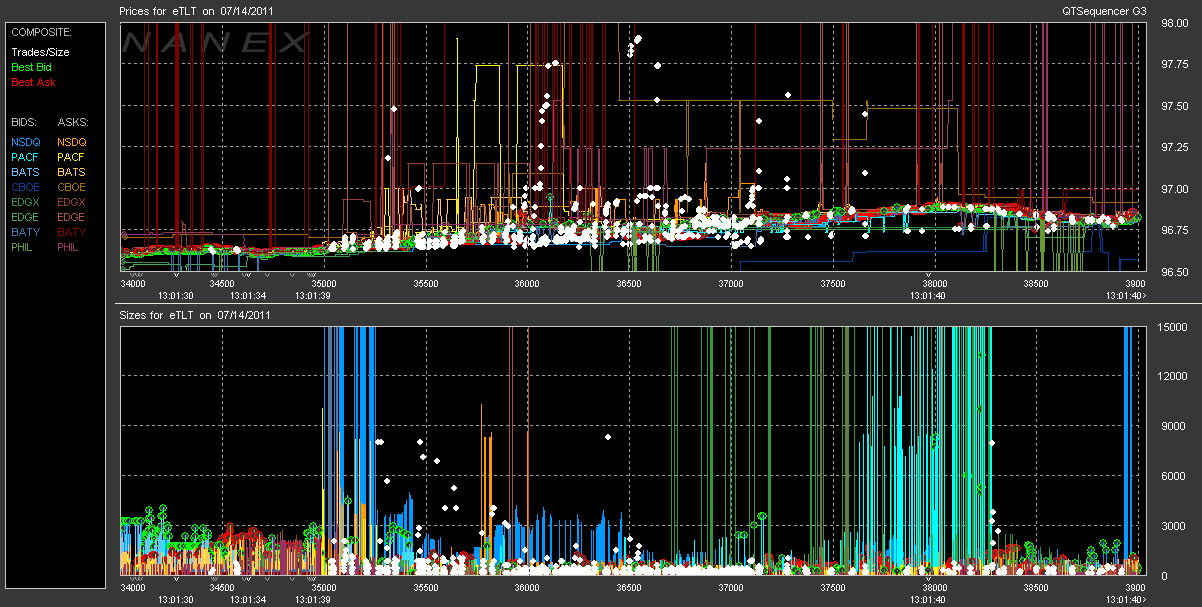
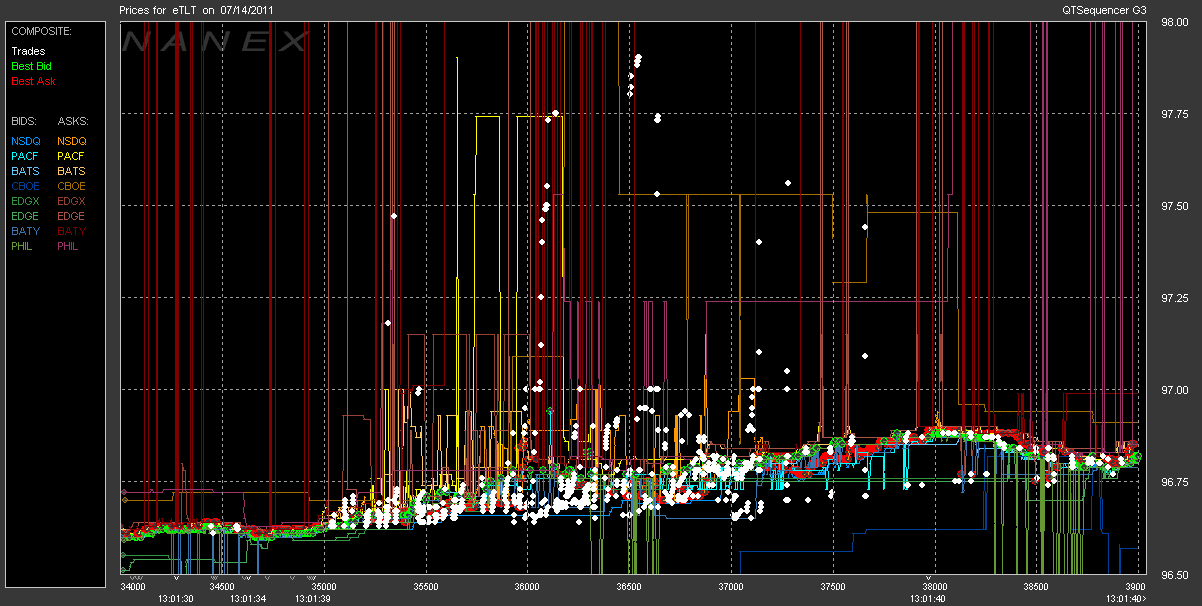
| On July 14, 2011 at 13:01:39, the ETF stock TLT rocketed from $96.63 to
$97.90 and then dropped back down in less than 1 second. Notice how the bid/ask
spread is a nice tight 1 penny wide right before the event. But almost
instantly -- in a far shorter time than it takes the speed of light to travel a
few miles -- the spread explodes to 25 cents or higher. Yes, the spreads are
normally small, but not when there is any real trading going on. Any study or
research paper that averages bid/ask spreads over any period of time, is
probably based on fantasy more than fact. |
In the first series of charts we scatter plot the bids, asks and trades from a
single exchange.
TLT - iShares BARCLAYS 20+ Year Trust
In the next series of charts we plot trades and quotes from all exchanges.
Combined Price and Sizes:
Combined Price Only:
|
Inquiries: pr@nanex.net
Publication Date: 07/14/2011
http://www.nanex.net
| This report and all material shown on this
website is published by Nanex, LLC and may not be reproduced, disseminated, or
distributed, in part or in whole, by any means, outside of the recipient's
organization without express written authorization from Nanex. It is a
violation of federal copyright law to reproduce all or part of this publication
or its contents by any means. This material does not constitute a solicitation
for the purchase or sale of any securities or investments. The opinions
expressed herein are based on publicly available information and are considered
reliable. However, Nanex makes NO WARRANTIES OR REPRESENTATIONS OF ANY SORT
with respect to this report. Any person using this material does so solely at
their own risk and Nanex and/or its employees shall be under no liability
whatsoever in any respect thereof. |
|
|
|

