Strange Days July 28, 2011 - RTSA Illustrates the Illusion of
Liquidity
|
Back to
Table Of Contents
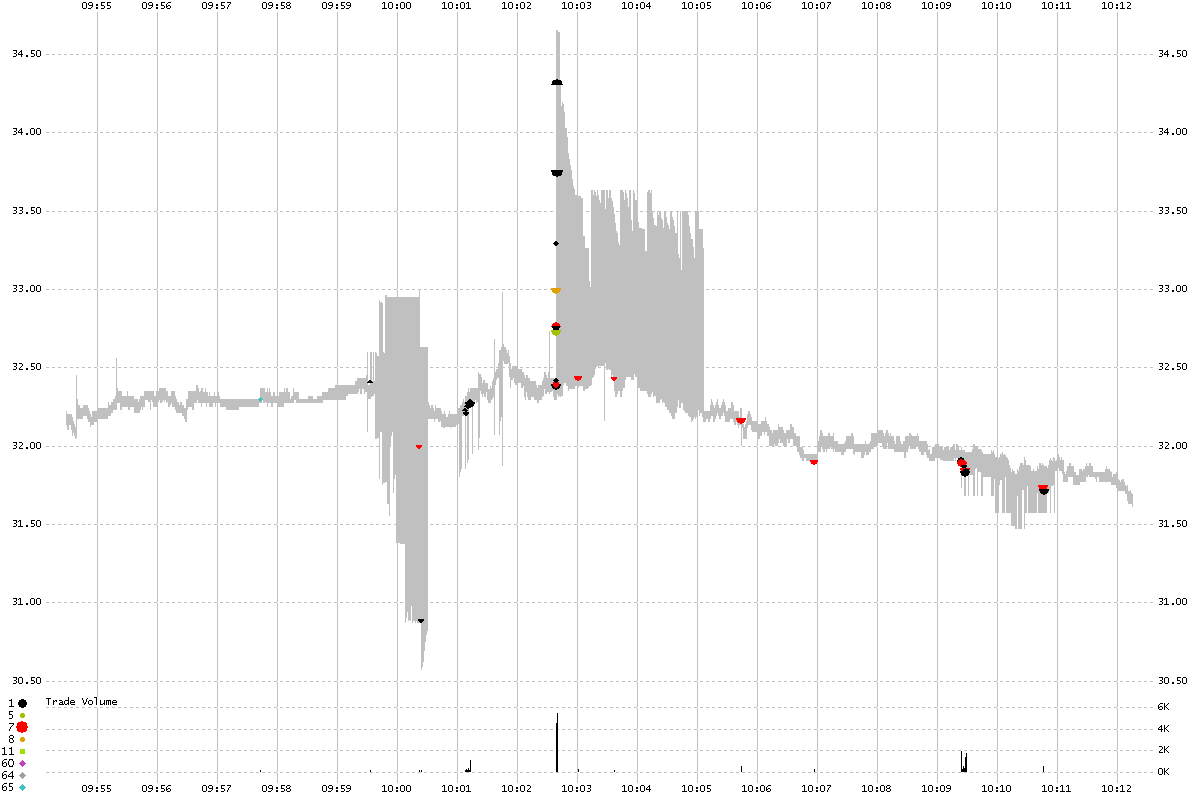
On July 28th the ETF iPath Short Extended Russell 2000 (symbol
RTSA) nicely illustrates quote price instability, or how the NBBO represents the
Illusion of Liquidity. This is the new normal. It is also what a broken
market looks like.
Every study we have read that looks at bid/ask spreads, uses a methodology that would
conclude the spread for RTSA averages around 5 cents. The reason for this, is that
they simple focus on averages over the trading day. For many stocks, when there
is low trading activity, the spreads are indeed tight. But the moment that HFT systems
detect an impending order, the tight spreads evaporate, often at the speed of light.
Just look how quickly the spread goes from about 5 cents to over $1 when
trades appear.
In some cases, just a few hundred shares will cause the spread to collapse and volatility
to explode.
Then again, as we have
already pointed out, no one uses the NBBO anyway.
|
Chart 1 Showing the NBBO, trade and trade volume.

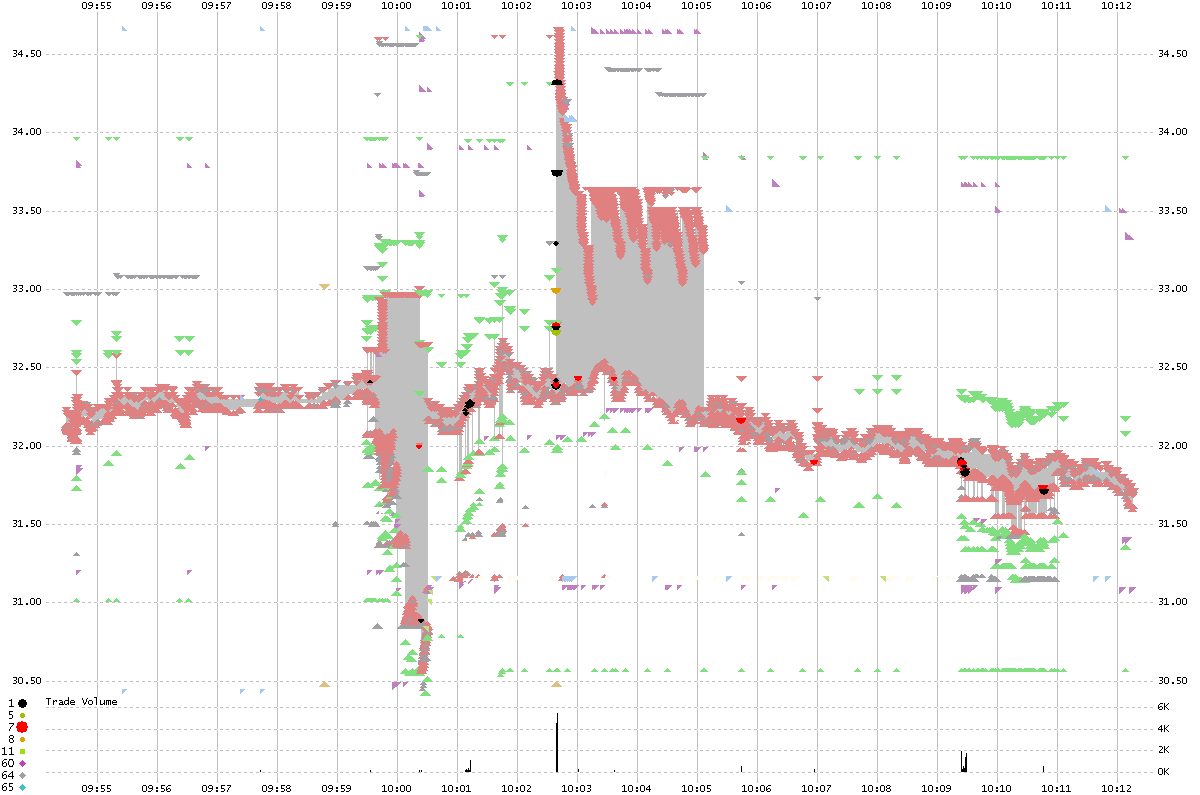
Chart 2 Includes bid and ask prices for each market center.

Legend:
Shade indicates National Best Bid and Offer Spread.
Semi-circles indicate trades.
Trade volume shown in lower panel.
Triangles represent bid (up) and ask (down) prices from each market center. (Chart 2 only)
Chart 3 Sequential Chart of Quotes and Trades

|
Inquiries: pr@nanex.net
Publication Date: 07/28/2011
http://www.nanex.net
| This report and all material shown on this
website is published by Nanex, LLC and may not be reproduced, disseminated, or
distributed, in part or in whole, by any means, outside of the recipient's
organization without express written authorization from Nanex. It is a
violation of federal copyright law to reproduce all or part of this publication
or its contents by any means. This material does not constitute a solicitation
for the purchase or sale of any securities or investments. The opinions
expressed herein are based on publicly available information and are considered
reliable. However, Nanex makes NO WARRANTIES OR REPRESENTATIONS OF ANY SORT
with respect to this report. Any person using this material does so solely at
their own risk and Nanex and/or its employees shall be under no liability
whatsoever in any respect thereof. |
|
|
|


