Back to
Table Of Contents
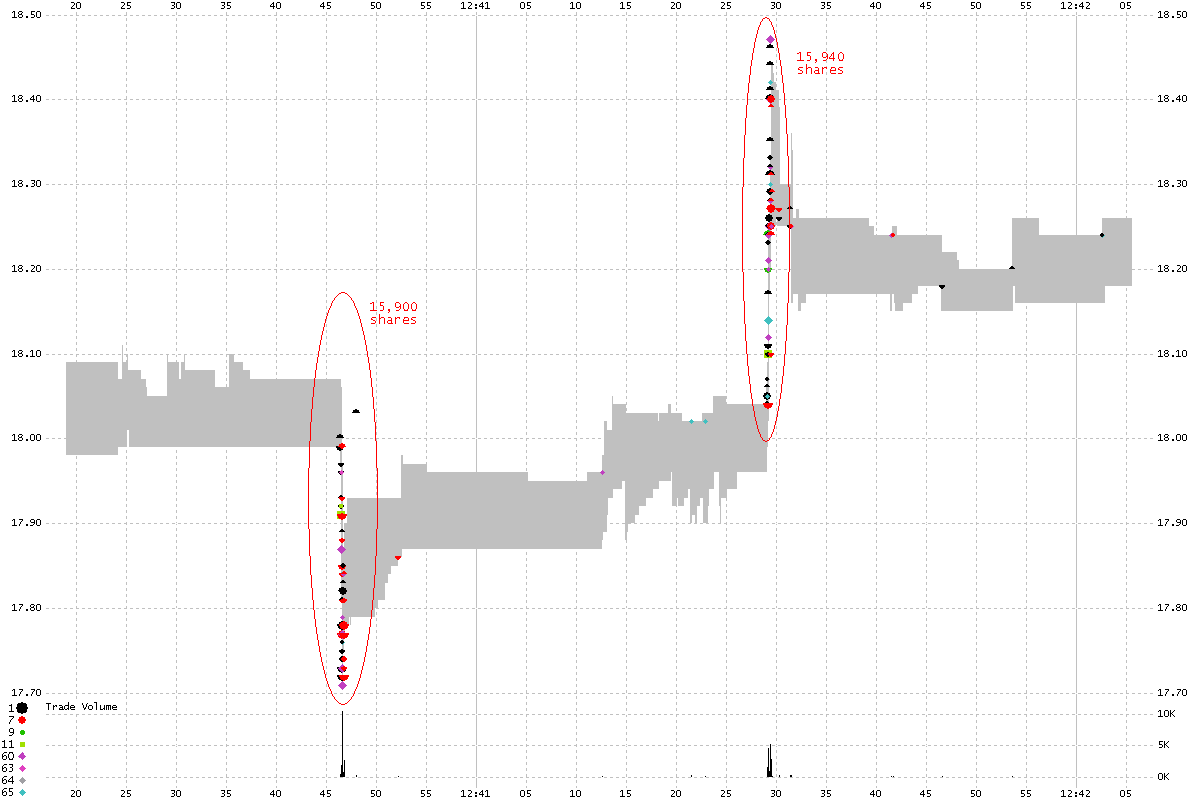
Below is a 100 millisecond interval chart of stock symbol PERY at 12:40:45 on
October 4, 2011. There was a sudden drop of approximately 30 cents, followed about
40 seconds later by a sudden rally of approximately 45 cents. Trades are circles,
and the NBBO is the shaded gray area. The sum of the trade volume shown in the left
circle is 15,900 shares. The sum of the trade volume shown in the right circle is
15,940 shares. Coincidence? If not, does anyone have a hypothesis on what is going
on here? This isn't an isolated case.
Please email pr@nanex.net with any information. |

|
Inquiries: pr@nanex.net
Publication Date: 10/05/2011
http://www.nanex.net
| This report and all material shown on this
website is published by Nanex, LLC and may not be reproduced, disseminated, or
distributed, in part or in whole, by any means, outside of the recipient's
organization without express written authorization from Nanex. It is a
violation of federal copyright law to reproduce all or part of this publication
or its contents by any means. This material does not constitute a solicitation
for the purchase or sale of any securities or investments. The opinions
expressed herein are based on publicly available information and are considered
reliable. However, Nanex makes NO WARRANTIES OR REPRESENTATIONS OF ANY SORT
with respect to this report. Any person using this material does so solely at
their own risk and Nanex and/or its employees shall be under no liability
whatsoever in any respect thereof. |
|
|
|


