Back to
Table Of Contents
On December 9, 2011, beginning at 11:01:16, there were two
anomalous and probably unrelated events in the symbols PDLI and BAC. Both events featured
a large amount
of trades from the BATS exchange. The PDLI event showed trade and quote price oscillations
similar to an algo we previously
documented in Natural Gas Futures. The BAC event was a blast of approximately
800 trades per second that sustained for 77 seconds in a row. The total number of
trades that occurred in BAC in this short period of time equaled about 30% of all trades
over the entire trading day.
1. PDLI Event
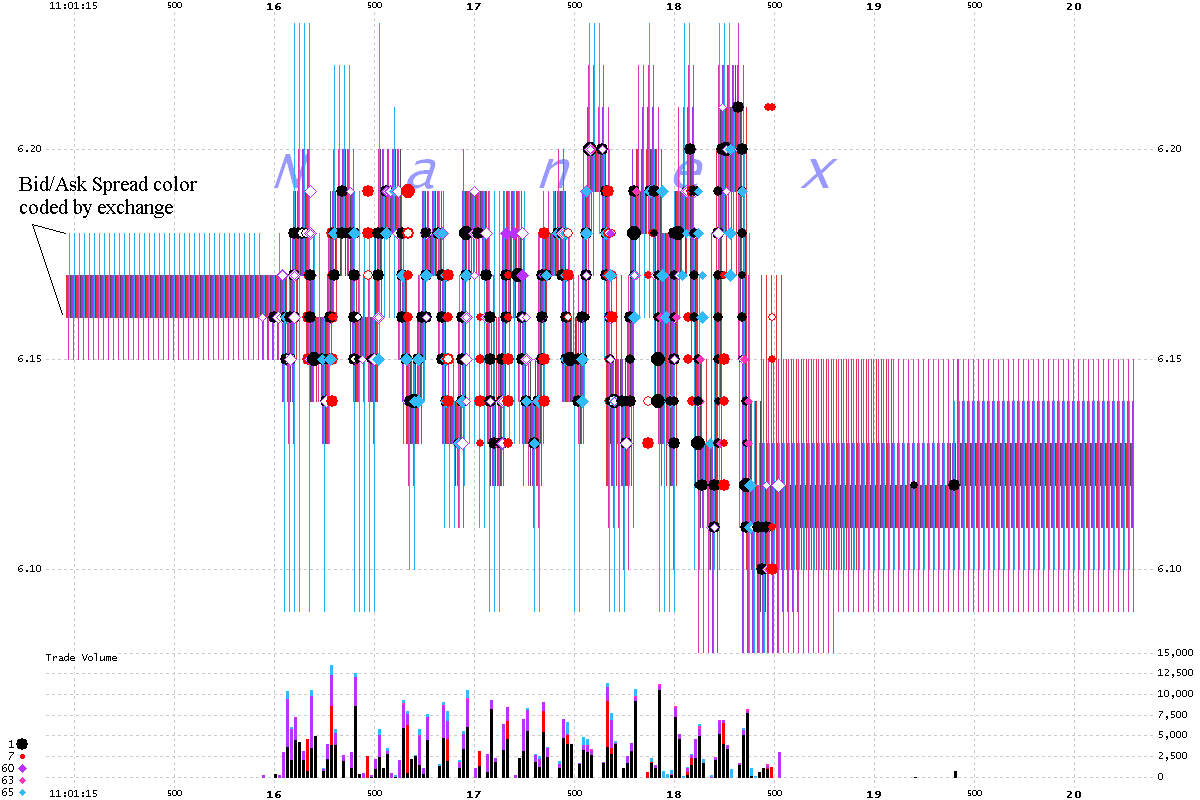
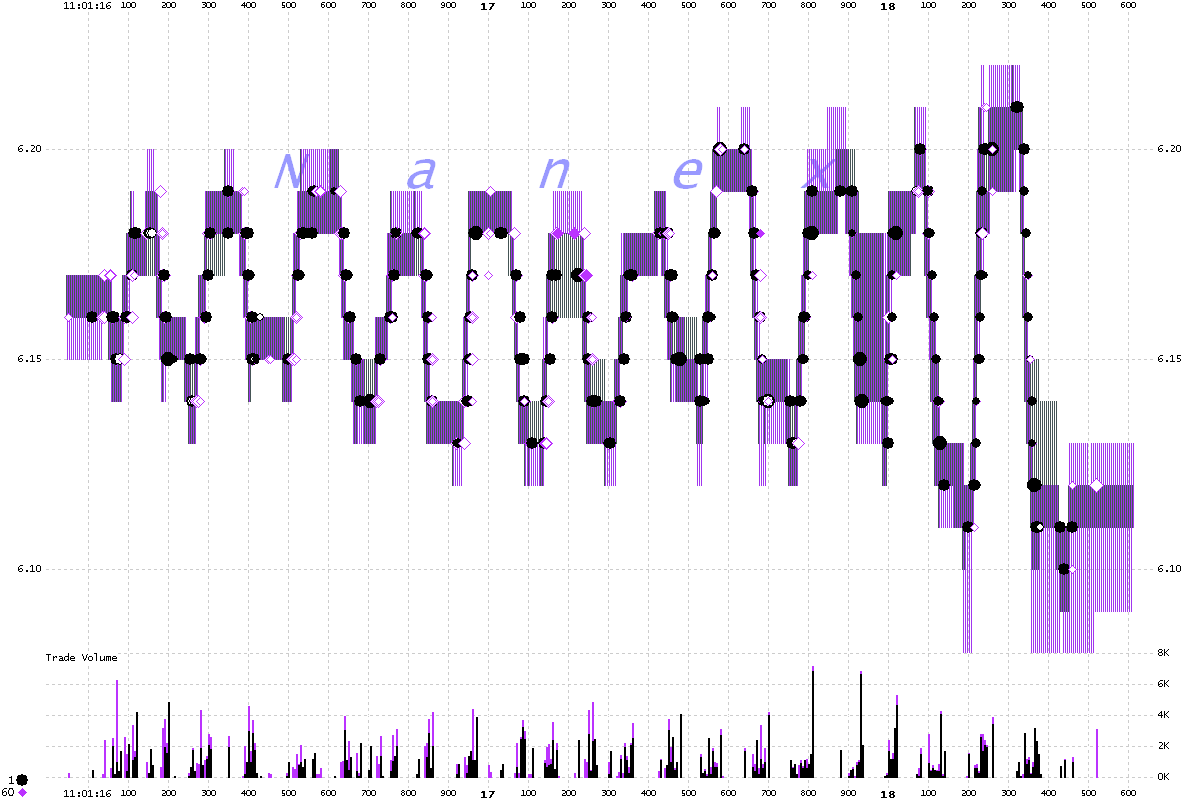
For 2.5 seconds beginning at 11:01:16, quote and trade prices in PDLI began oscillating
with a period of approximately 200 milliseconds. The chart below is a one second interval
chart showing a price spike that goes both up and down at the same time.
|

Below is a 20 millisecond interval chart that zooms in on the price spike from the chart above.
The next chart is a 5 millisecond interval chart showing only Nasdaq (black) and BATs
(magenta), allowing us to see a clear picture of the price oscillation.
2. BAC Event
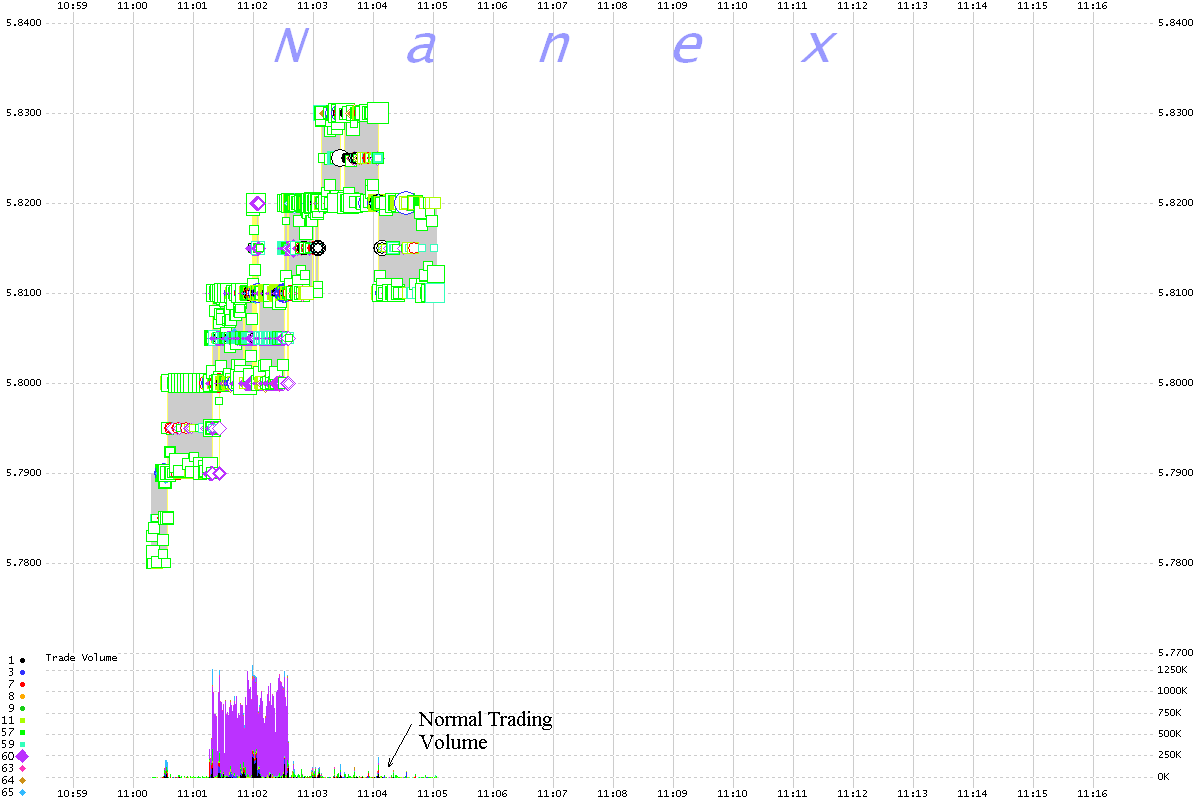
A high burst of trading
activity began in BAC at 11:01:19 and lasted for 77 seconds,
with the rate of trade executions averaging 800 per second. An amazing 30% of all
trades and 24% of all shares traded in BAC that day were executed during this 77 second
event. Most of these trades were reported from the BATS exchange (pink in
the charts that follow). |
The chart below shows trades (circles/squares), the best bid-ask spread (grey/yellow
shading) and trade volume over 1 second intervals. In the lower panel showing trade
volume for each interval, note how the wall of magenta towers over the normal trading
volume.
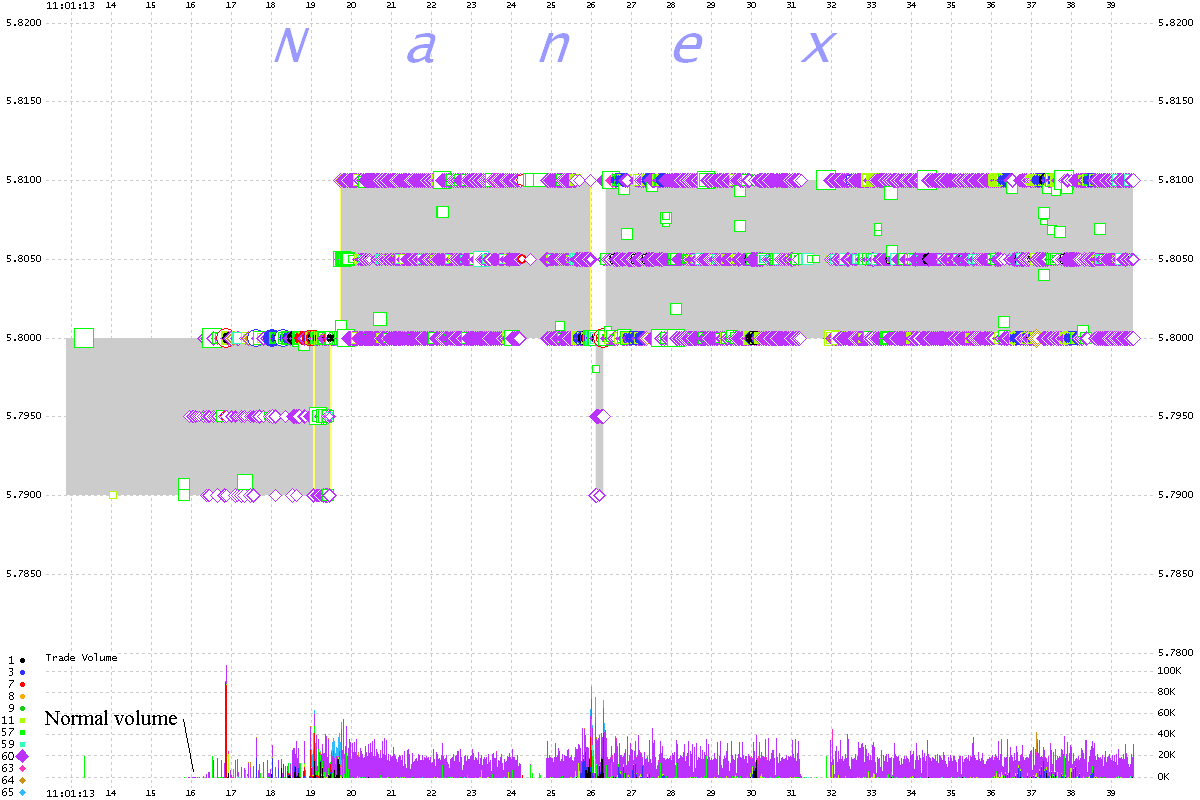
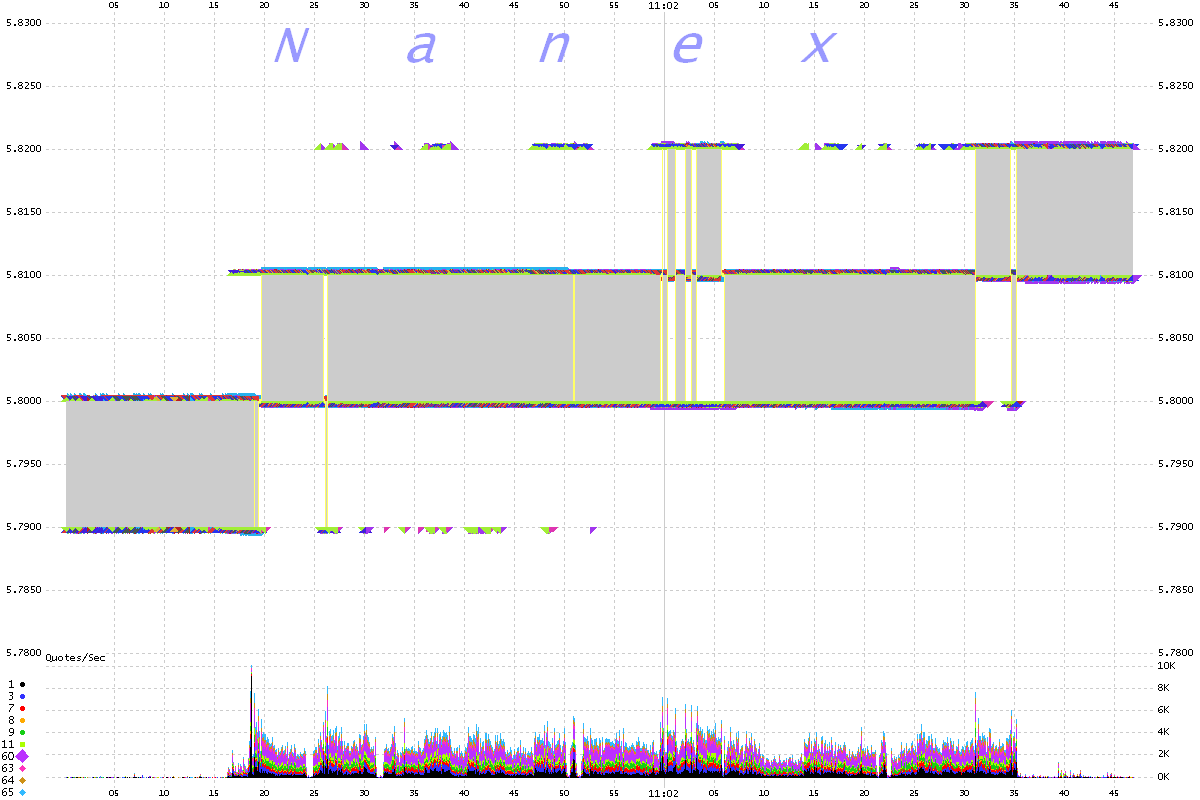
The 25 millisecond chart below shows a close-up of the event. You can see how quickly
trade prices flutter within 1 penny -- at 5.800, 5.805 and 5.810.
The 100 millisecond interval chart below shows the bids and offers from each exchange
(triangles), the best bid and offer (gray/yellow shading) and the quote rate during this event.
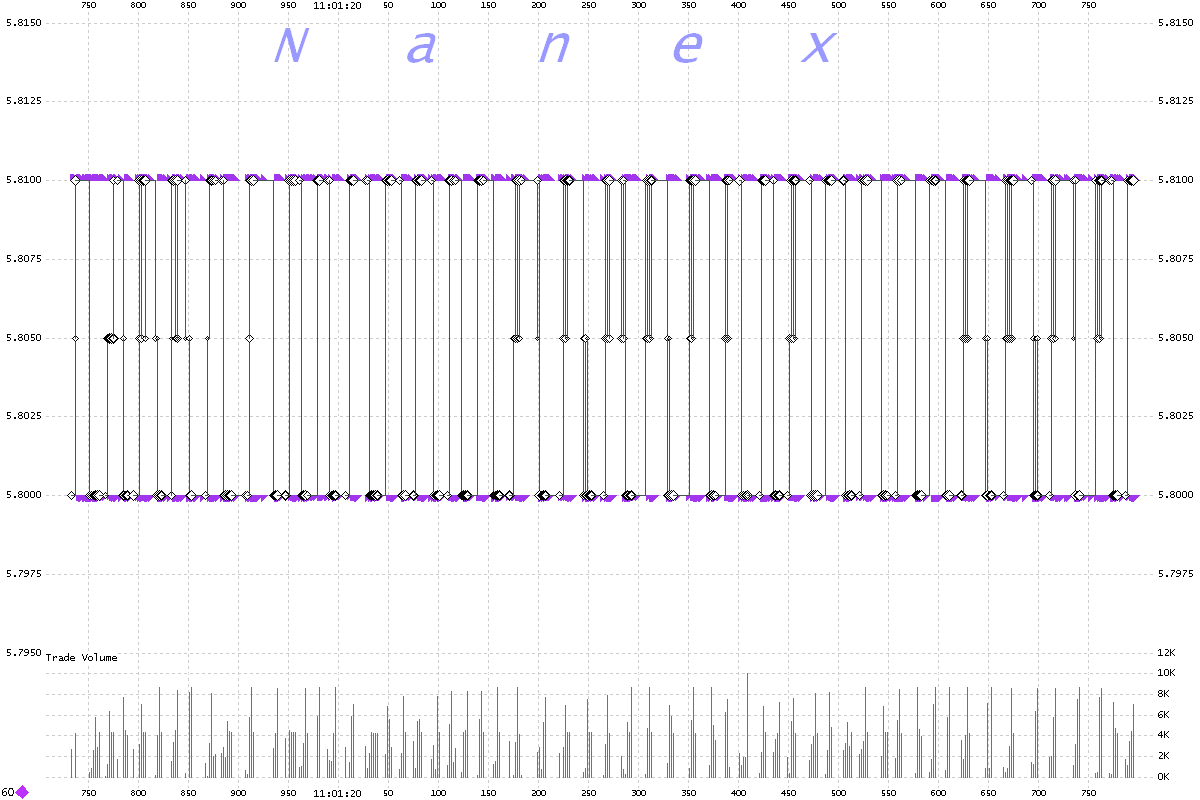
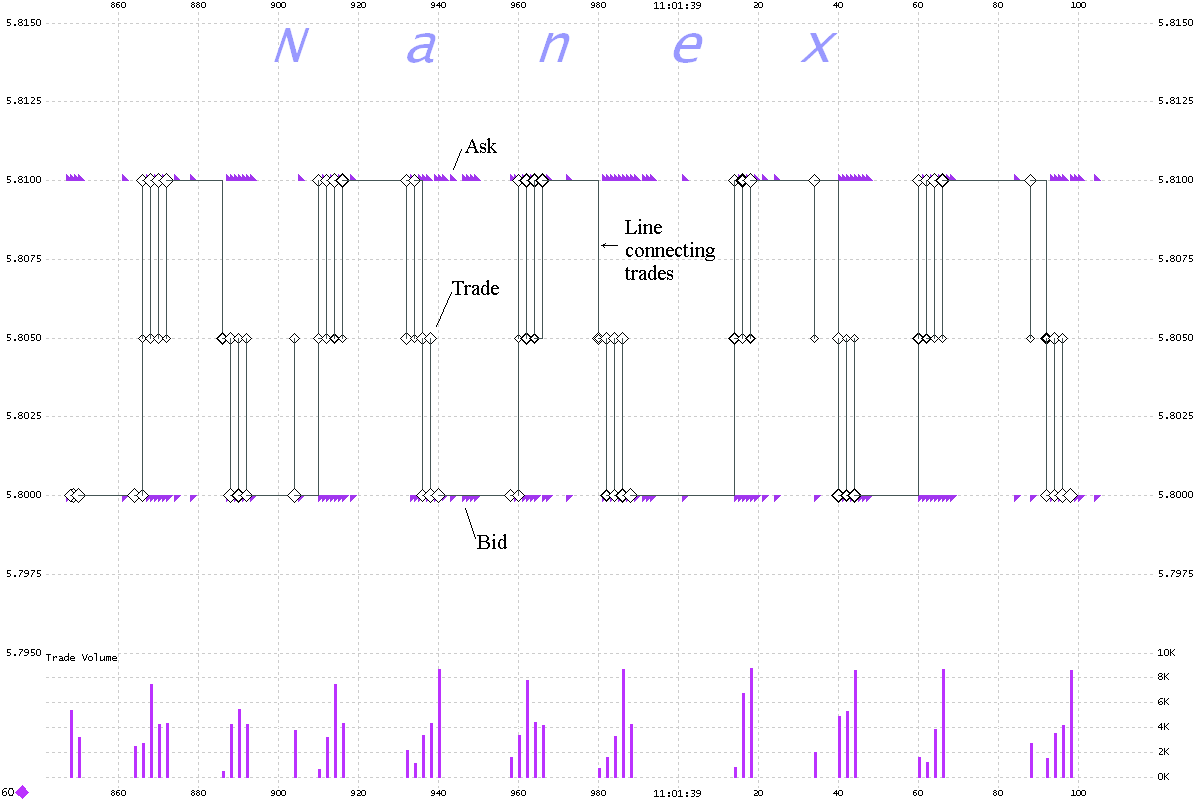
The last 2 charts detail trades and quotes from BATS on a 1 millisecond interval.
The black lines link sequential trade executions to help you distinguish the order.
Exchange Code Legend:
| 1 |
NQEX |
Nasdaq Exchange |
| 3 |
NYSE |
New York Stock Exchange |
| 4 |
AMEX |
American Stock Exchange |
| 5 |
CBOE |
Chicago Board Options Exchange |
| 6 |
ISEX |
International Securities Exchange |
| 7 |
PACF |
NYSE ARCA |
| 8 |
CINC |
National Stock Exchange |
| 9 |
PHIL |
Philidelphia Stock Exchange |
| 11 |
BOST |
Boston Stock/Options Exchange |
| 17 |
CHIC |
Chicago Stock Exchange |
| 59 |
NTRF |
NYSE Trade Reporting Facility |
| 60 |
BATS |
BATS Trading |
| 63 |
BATY |
BATS Y Exchange |
| 64 |
EDGE |
Direct Edge A |
| 65 |
EDGX |
Direct Edge X |
|
Inquiries: pr@nanex.net
Publication Date: 12/13/2011
http://www.nanex.net
| This report and all material shown on this
website is published by Nanex, LLC and may not be reproduced, disseminated, or
distributed, in part or in whole, by any means, outside of the recipient's
organization without express written authorization from Nanex. It is a
violation of federal copyright law to reproduce all or part of this publication
or its contents by any means. This material does not constitute a solicitation
for the purchase or sale of any securities or investments. The opinions
expressed herein are based on publicly available information and are considered
reliable. However, Nanex makes NO WARRANTIES OR REPRESENTATIONS OF ANY SORT
with respect to this report. Any person using this material does so solely at
their own risk and Nanex and/or its employees shall be under no liability
whatsoever in any respect thereof. |
|
|
|


