Back to Table Of Contents

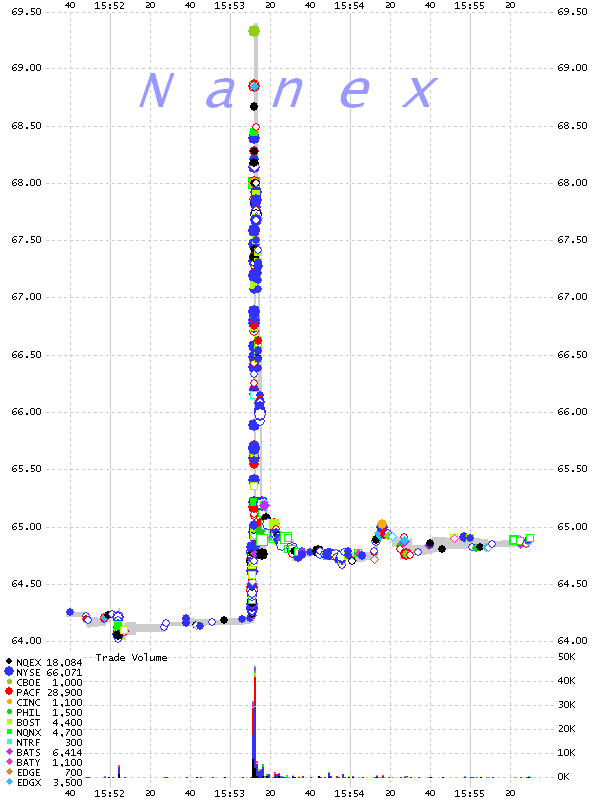
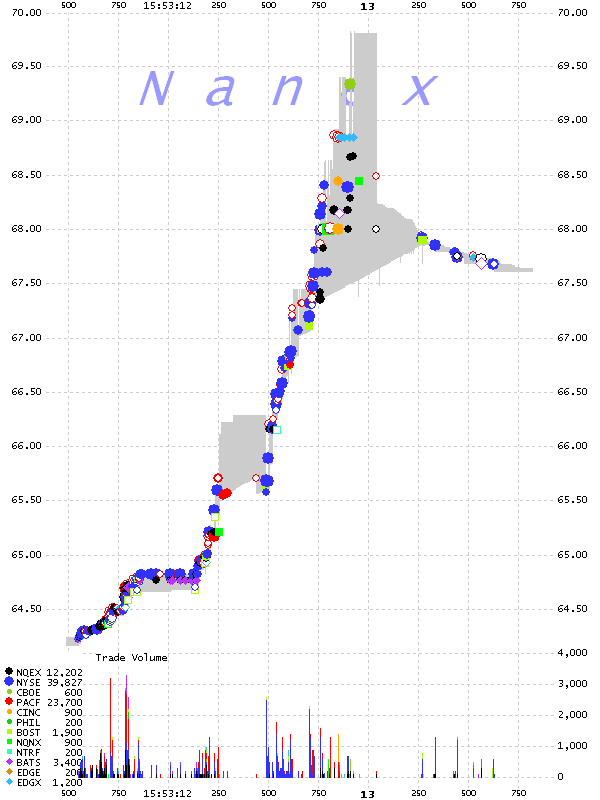
On December 14, 2011 at 15:53:11, the stock Westinghouse Air Brake Technologies
Corp (NYSE:WAB), suddenly exploded from $64.22 to $69.33 in just over 1 second. The
price was back under $65 just 3
seconds later. Most market structure problems caused
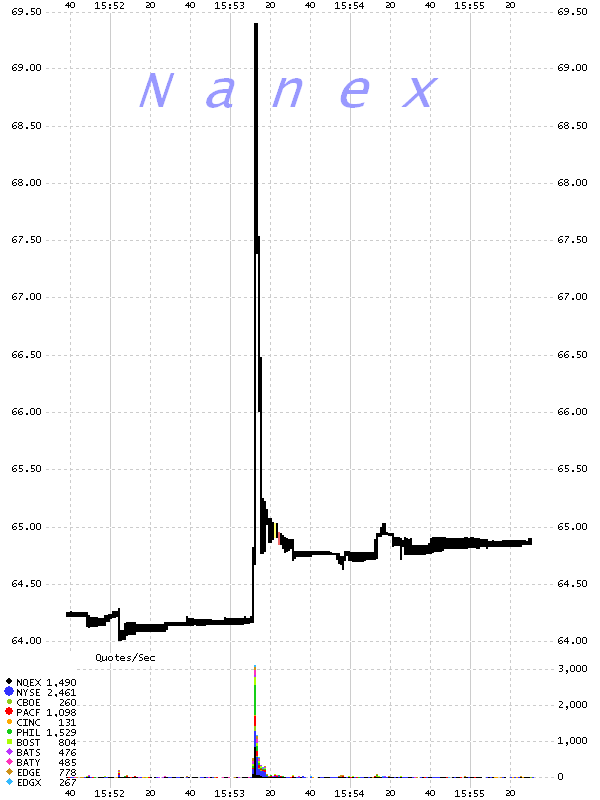
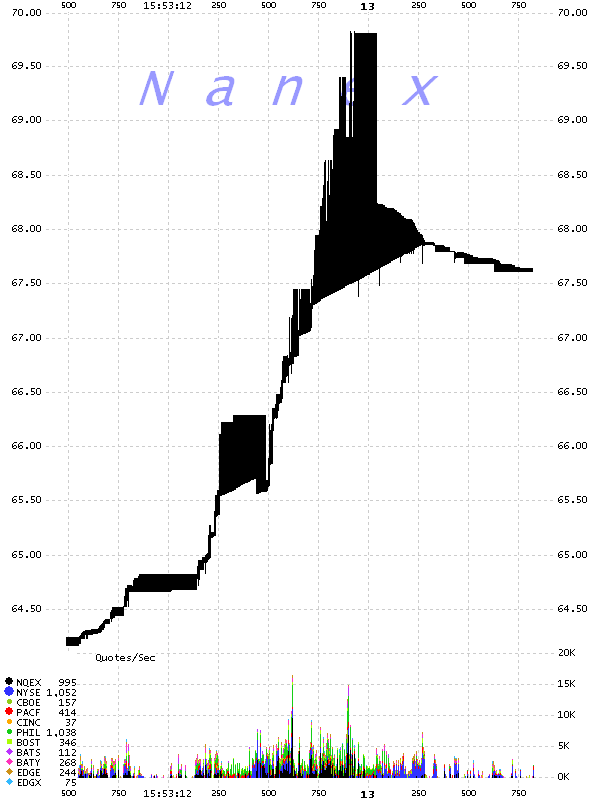
by an algo running wild are confined to a few exchanges (rarely more than 3) and the NBBO ends up nearly
always locking or crossing. In the WAB event, the NBBO never locks or crosses (not until after the price returns below $65), even with all 11 exchanges
participating. The number of exchanges involved, plus the speed and magnitude
of this move, and the fact the NBBO doesn't lock or cross is simply unprecedented.
WAB has a market cap of $3.1 billion and trades an average of 240,000 shares a day.
There were no news events during the day, and no news events the following day.
No trades were canceled by the exchange.
|
|
Below are 2 sets of 1 second interval charts; the left chart shows trades and trade
volume, the right shows the NBBO quote (black shade) and quote rates.
Note the sharp the spike in the NBBO.
The spike is just noticeable on a 1 second interval, any resolution at larger time
frames (e.g. 1 minute bar chart) would make the spike appear as a single bad price tick.
|
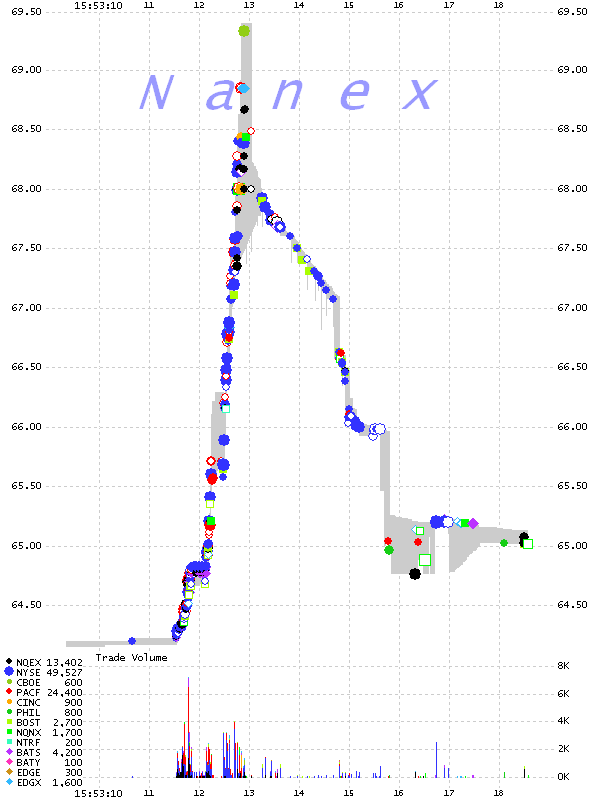
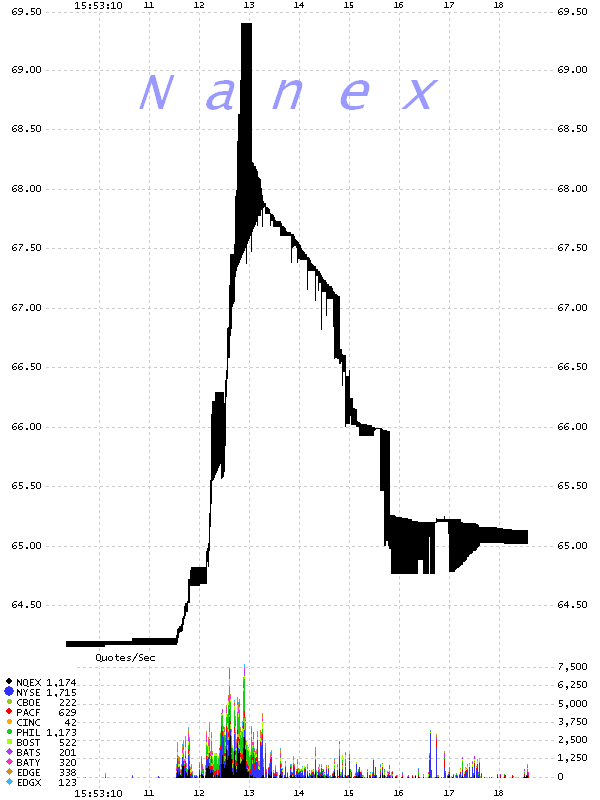
The next two charts are zoomed in views at
20 ms intervals.
Zooming further to 5 ms intervals.
|
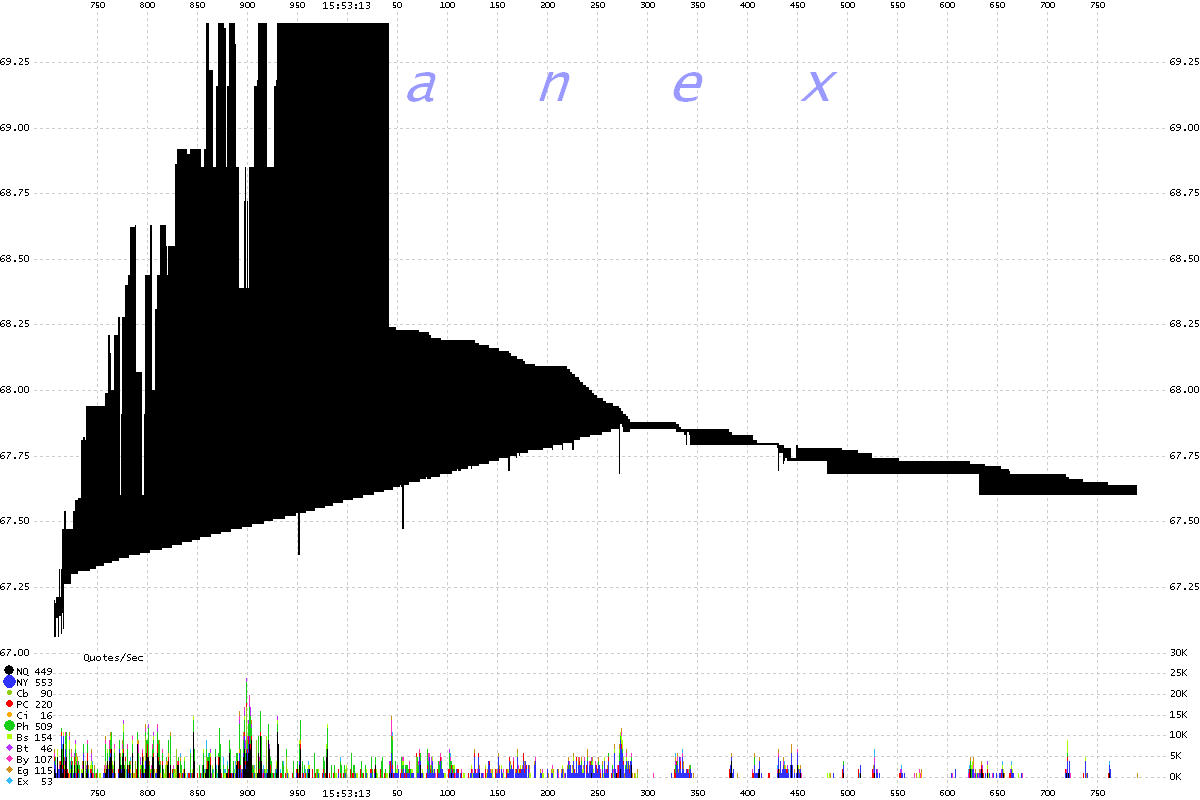
The next chart shows the NBBO at on 1 millisecond basis. Note how quickly and often the NBBO changes. This chart shows about 1 second's worth of data. |
|
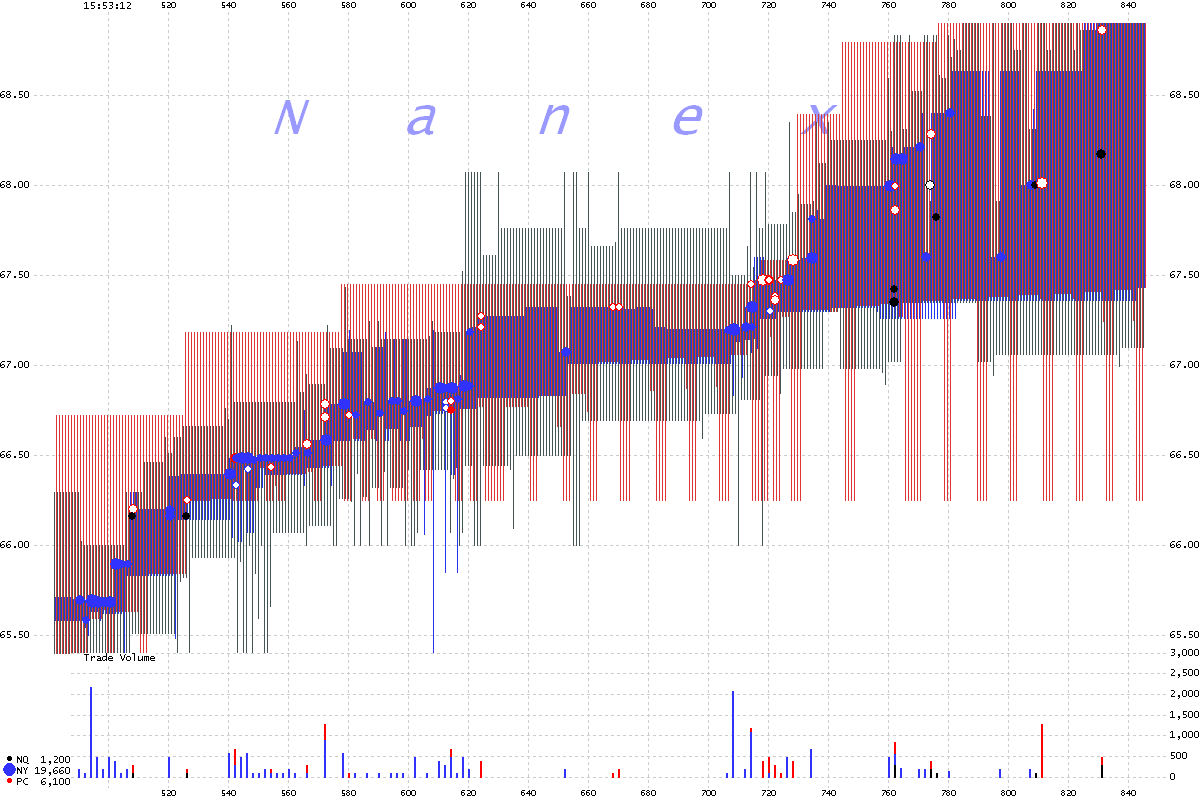
The chart below shows 3 of the more active exchanges during this event. The bid/ask spread for each exchange is shown as vertical lines, which are color coded according to the legend at the bottom. Note how quickly quote prices change on each
exchange. This chart shows less than 1/2 second of data. |
After looking at the data during the event, we happened to look at trades executed
after the close and found 15,700 shares executed with a trade condition of "average
price", which usually means VWAP trades. So we dumped all trades and computed the
VWAP. Our computed VWAP matched (to
3 decimal places!) the price that the "average price" trades were executed.
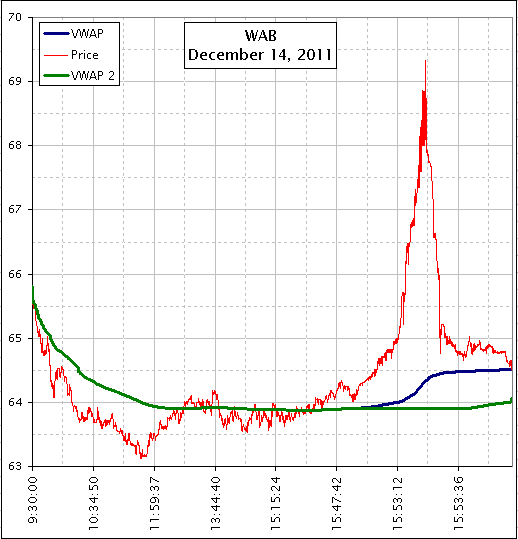
We wondered what the VWAP would be if the price spike never occurred. Answer: about
50 cents lower. On 15,700 shares, it's about a $7,000 difference.
We can't help wondering that since the event happened only 7 minutes before the close,
if someone knew the trade was coming and tried to jack up the prices, and it ended
up getting away from them, or maybe they intended it to be as spectacular as it was?
|

The chart below shows WAB trades (red), the running VWAP (blue), and our estimated
VWAP (green) if the price spike never occurred.
|
Inquiries: pr@nanex.net
Publication Date: 12/15/2011
http://www.nanex.net
| This report and all material shown on this
website is published by Nanex, LLC and may not be reproduced, disseminated, or
distributed, in part or in whole, by any means, outside of the recipient's
organization without express written authorization from Nanex. It is a
violation of federal copyright law to reproduce all or part of this publication
or its contents by any means. This material does not constitute a solicitation
for the purchase or sale of any securities or investments. The opinions
expressed herein are based on publicly available information and are considered
reliable. However, Nanex makes NO WARRANTIES OR REPRESENTATIONS OF ANY SORT
with respect to this report. Any person using this material does so solely at
their own risk and Nanex and/or its employees shall be under no liability
whatsoever in any respect thereof. |
|
|
|


