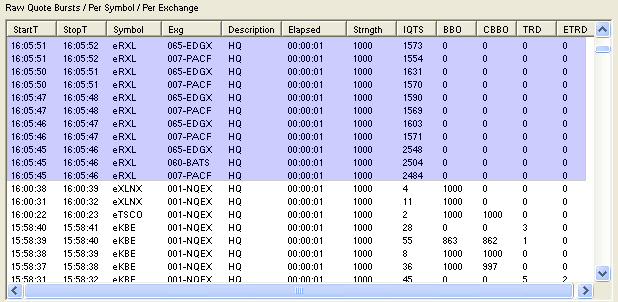
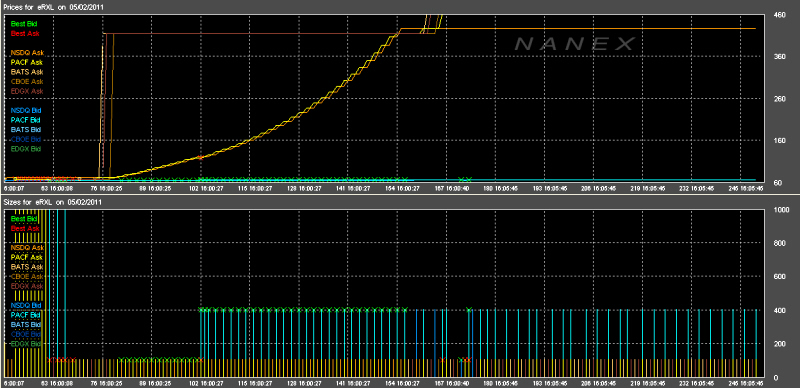
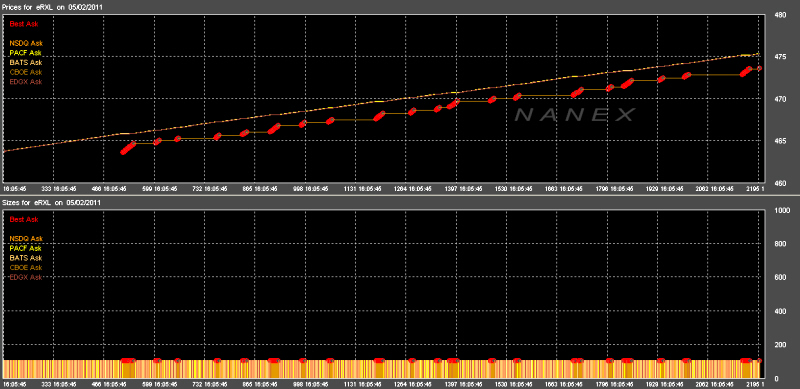
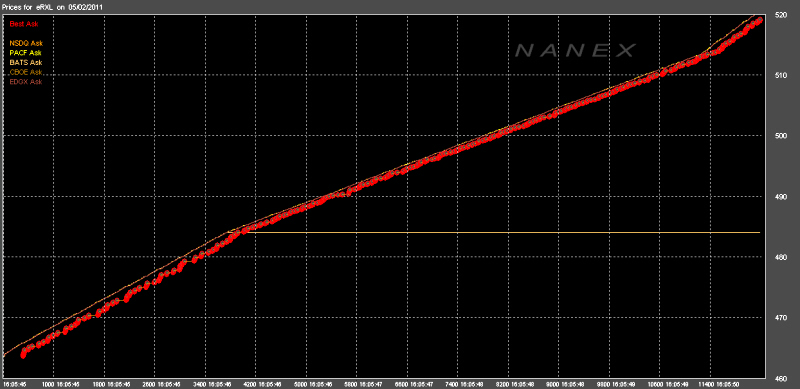
Back to RETF Algo Contents First Sighting The first time this algo was seen was on 05/02/2011. Just a few small blips in one symbol on one of our most basic high frequency quote monitors:  What was unique was that it occurred after market hours (which is not that rare but enough to make it a curiosity) and when examined we found it involved multiple exchanges (normally we see run-up run-down algo sequences originating from a single exchange). This is not to imply the algo itself is running on multiple exchanges (although it is within the realm of possibility), but that quotes from other exchanges are following the price movement and quoting at or near the same (outrageous) level. In the following charts, trades and quotes are plotted sequentially as they occur. As such, no data is lost. Exchange's bid and ask prices are colored according to the legend on the left. When quotes are the NBBO, a red circle is drawn for the Best Ask, and a Green circle for the Best Bid. Click on any chart for a high resolution image. Symbol RXL Chart #1: The first sequence of 250 quotes shows the ask price being run up incrementally from $60 to over $400.  Chart #2: This chart shows the ask price continues to rise, although due to the bid price being so low the scale makes it appear to be flat:  Chart #3: Removing the bids we can see that the ask price continues to incrementally rise and affect the NBBO as it does:  Chart #4: This rise to over $500 occurs in approx. 6 seconds, with approx. 18,000 quotes being generated in the sequence: 
|

