Back to RETF Algo Contents
On week two the algo begins to affect both the bid and the ask price and also
begins to run on numerous additional symbols. It does not take the bid price to
zero but to a much lower level before stopping, while the ask price continues
to rise:
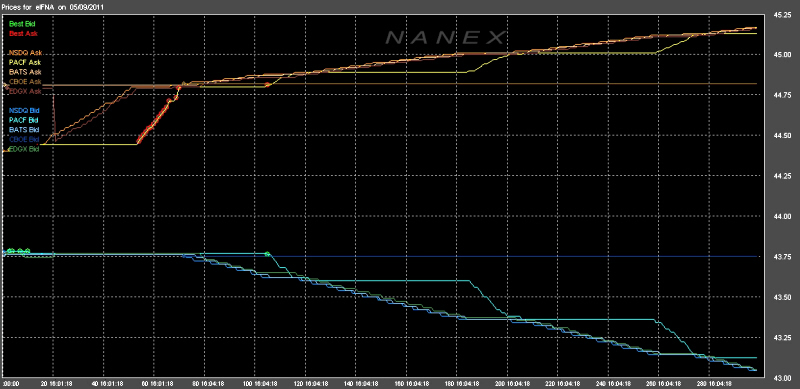
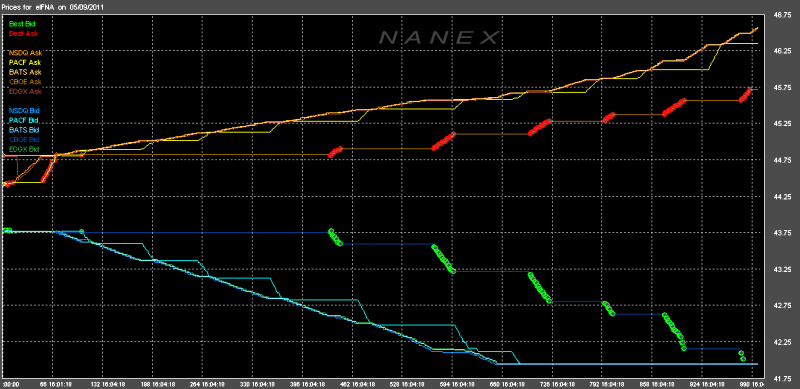
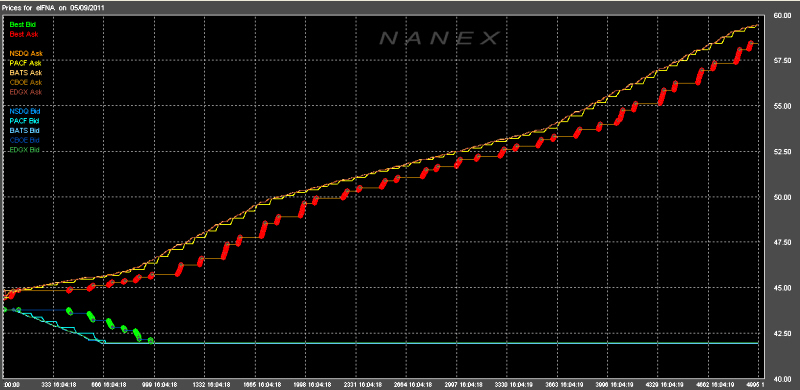
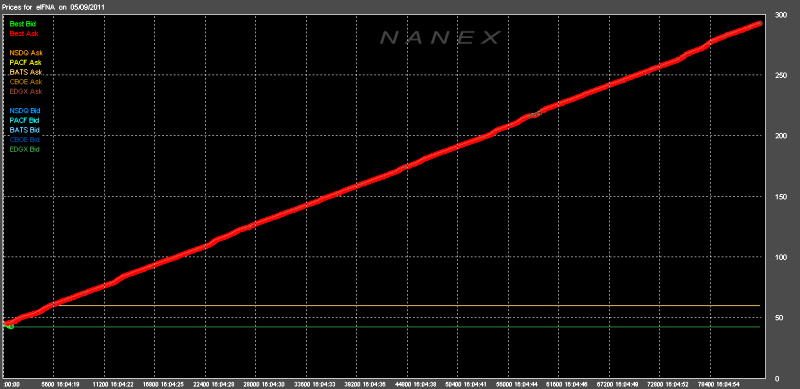
In the following charts, trades and quotes are plotted sequentially as they
occur. As such, no data is lost. Exchange's bid and ask prices are colored
according to the legend on the left. When quotes are the NBBO, a red circle is
drawn for the Best Ask, and a Green circle for the Best Bid.
Click on any chart for a high resolution image.
Symbol IFNA
Chart #1: The first 300 quotes:

Chart #2: 1000 quotes:

Chart #3: 5000 quotes:

Chart #4: 84,000 quotes:

|
Inquiries: pr@nanex.net
Publication Date: 06/13/2011
http://www.nanex.net
| This report and all material shown on this
website is published by Nanex, LLC and may not be reproduced, disseminated, or
distributed, in part or in whole, by any means, outside of the recipient's
organization without express written authorization from Nanex. It is a
violation of federal copyright law to reproduce all or part of this publication
or its contents by any means. This material does not constitute a solicitation
for the purchase or sale of any securities or investments. The opinions
expressed herein are based on publicly available information and are considered
reliable. However, Nanex makes NO WARRANTIES OR REPRESENTATIONS OF ANY SORT
with respect to this report. Any person using this material does so solely at
their own risk and Nanex and/or its employees shall be under no liability
whatsoever in any respect thereof. |
|
|
|


