Back to RETF Algo Contents We now see the algo affecting both the bid and the ask price and in many cases, taking the bid price (in incremental steps) to near zero (0.01). When the bid price hits 0.01 it then returns to the normal price range, while the ask price continues into the stratosphere. We also see the algo filling our high quote frequency/algo monitors every day: In the following charts, trades and quotes are plotted sequentially as they occur. As such, no data is lost. Exchange's bid and ask prices are colored according to the legend on the left. When quotes are the NBBO, a red circle is drawn for the Best Ask, and a Green circle for the Best Bid. Click on any chart for a high resolution image. Symbol GASL Chart #1:. The first 500 quotes of the sequence: 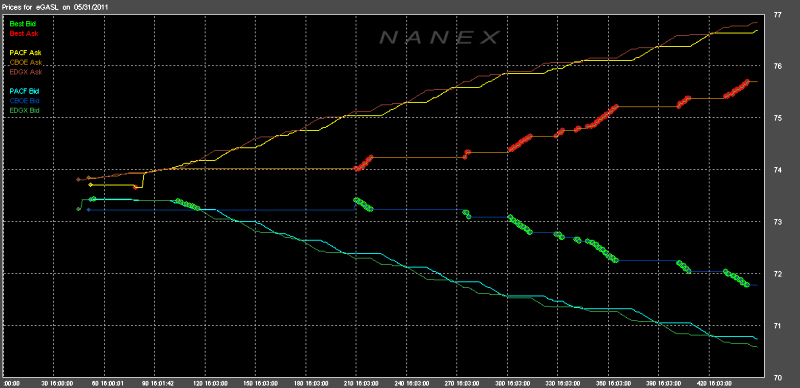 Chart #2: 1,000 quotes: 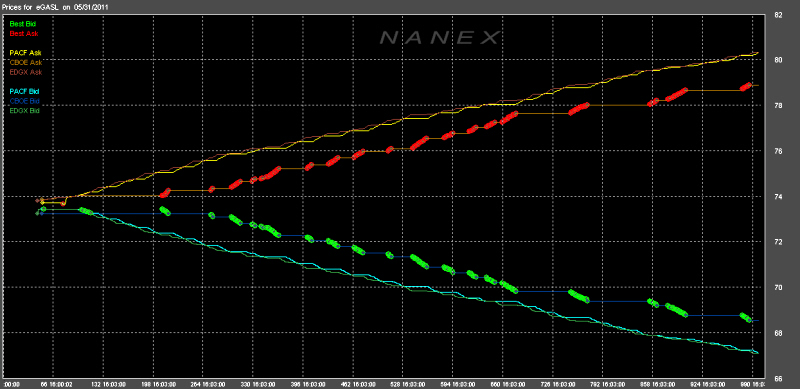 Chart #3: 5,000 quotes: 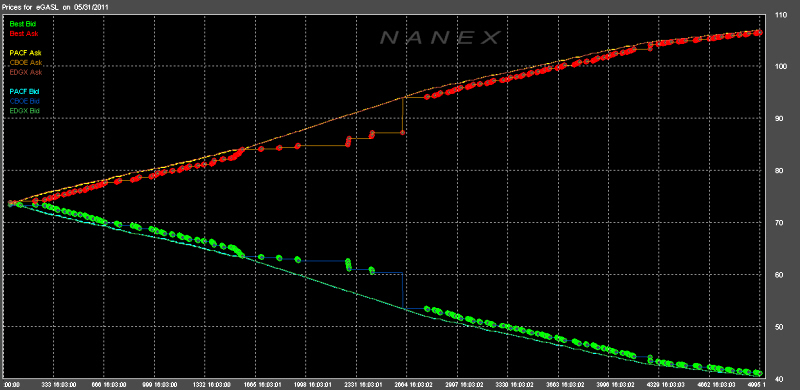 Chart #4: After approx 14,000 quotes the bid price hits zero, then rebounds to a previous price before the sequence began: 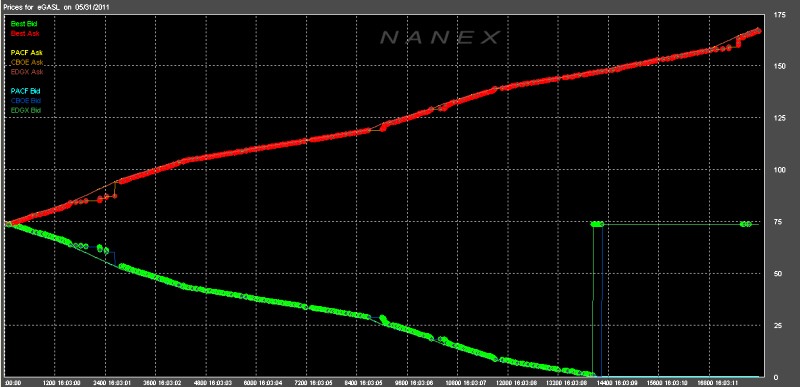 Chart #4:Symbol GASL - The Ask price continues to rise. 84,000 quotes shown below in approx. 41 seconds: 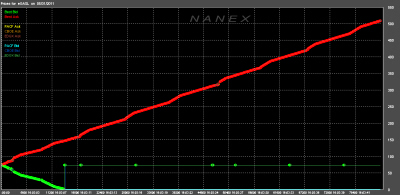
|

