Nanex Research

Nanex ~ 10-Oct-2011 ~ SPY
The follow chart is for SPY (the most actively traded symbol) on October 10, 2011 at 12:03:40 EDT.
CQS processes quotes in SPY for all exchanges, and CTA processes trades in SPY from
all exchanges. These are 2 separate systems. If there is a problem with CQS, then quotes
will be delayed for all exchanges. If there is a problem with an exchange sending quotes
to CQS, then just that exchange's quotes will be delayed.
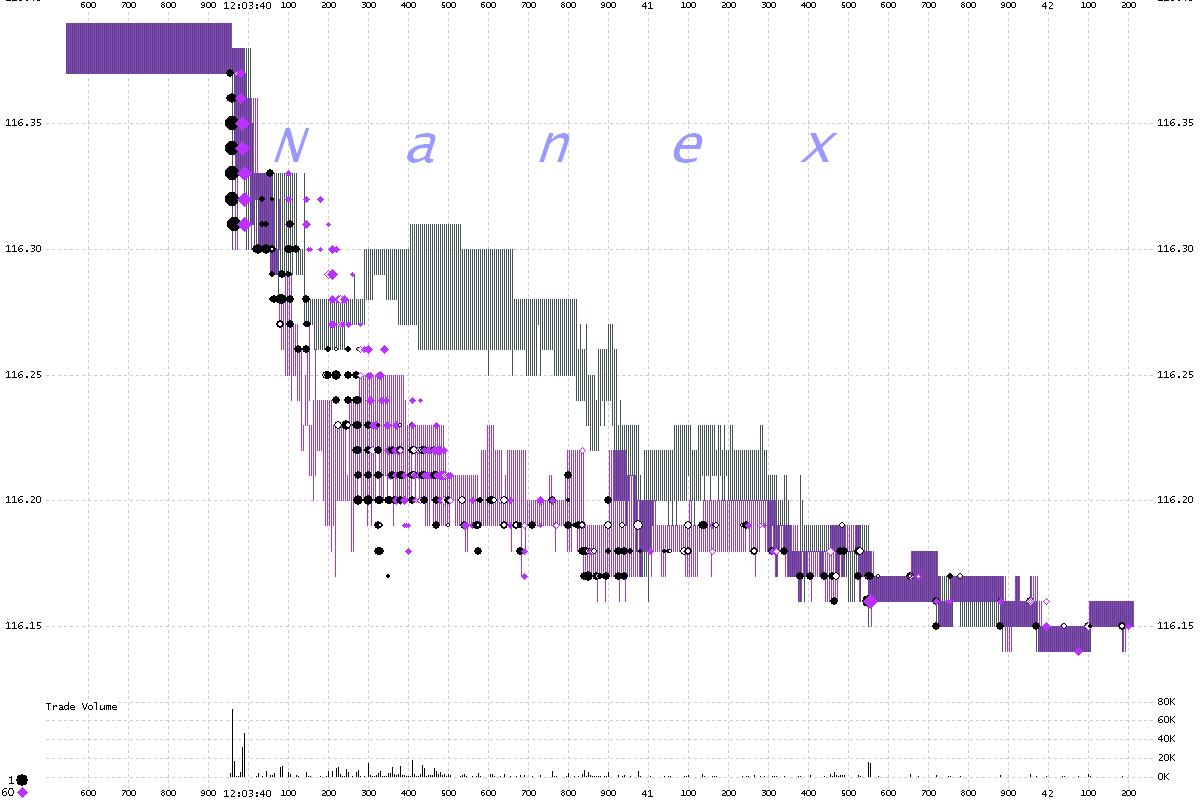
In the chart below, we can see that Nasdaq quotes (the gray shading) are delayed relative
to BATS quotes (purple shading). But we can also see that Nasdaq trades (black dots)
appear before, or at the same time as BATS trades (purple diamonds). The only way that
this can occur, is if the quotes sent by Nasdaq to the consolidated (CQS) are delayed,
but trading occurs as if there is no delay, because the direct feed is not delayed.
Therefore.
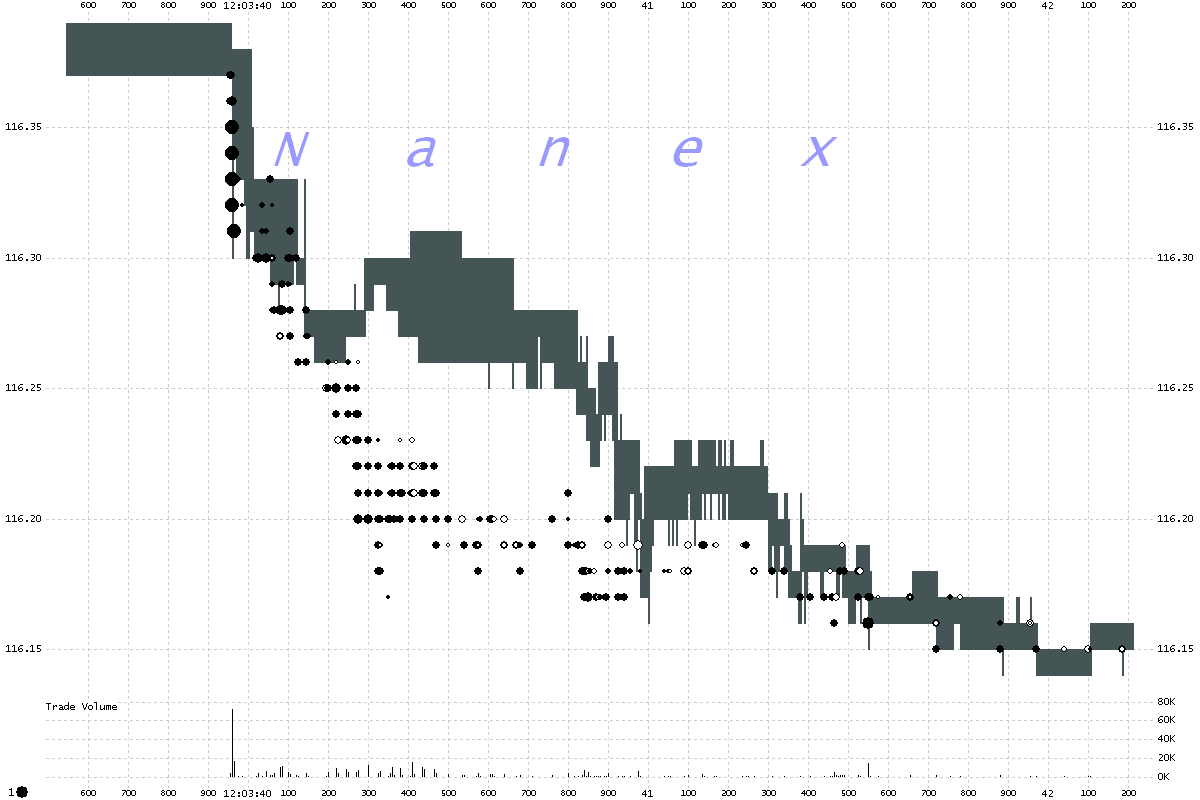
- If both Nasdaq's direct feed and Nasdaq's feed to the consolidated were both delayed,
we would see Nasdaq trades below (black dots) line up with the gray shading.
- If the consolidated quotes feed was delayed, we would see BATS quotes (purple shading)
line up with Nasdaq quotes (gray shading) and trades would print as they are now.
- If Nasdaq's direct feed was not delayed, but their connection to the consolidated
was, we would see *exactly* what is shown below:
1. SPY 1 millisecond interval chart showing trades and quote spreads for Nasdaq
(black/gray) and BATS (purple. Other exchange data removed for clarity.

2. SPY 1 millisecond interval chart showing trades and quote spread for Nasdaq

Nanex Research


