See also PDLI which occurred at the same time.
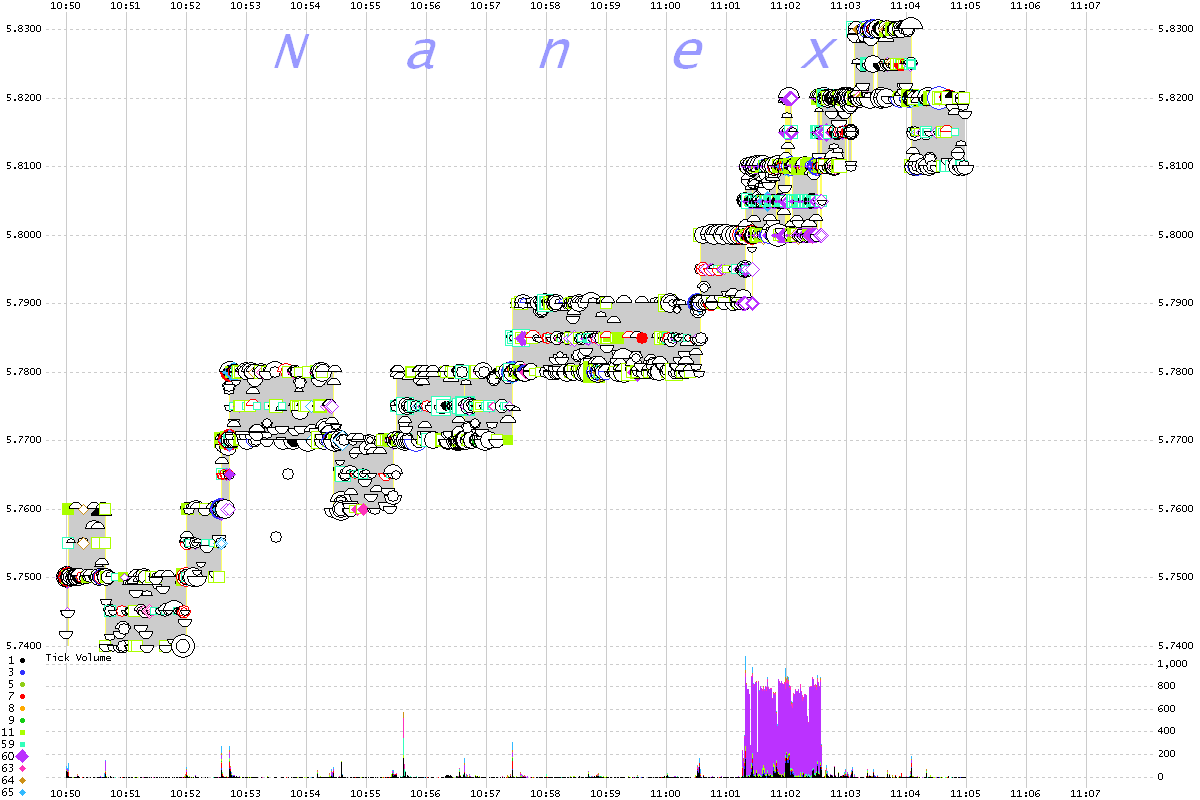
BAC ~ 1 second chart on Dec 9, 2011
Circles are trades. Shaded area is BBO
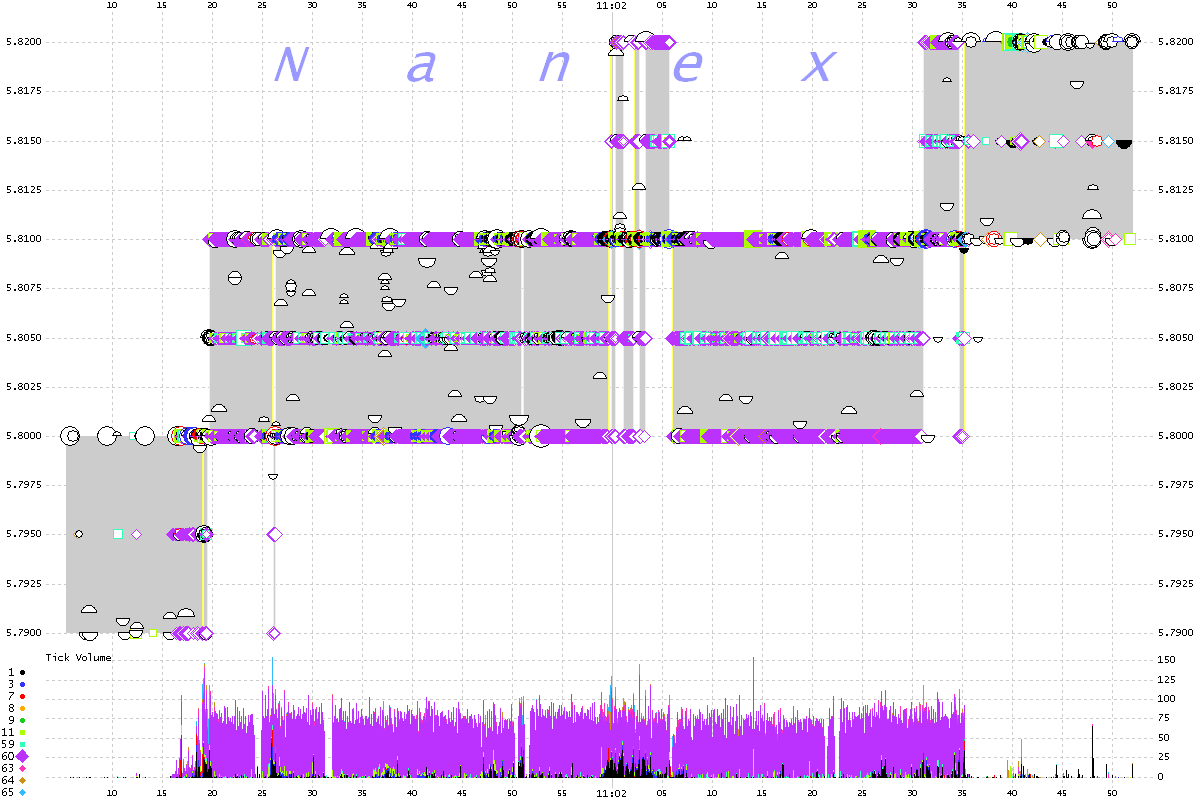
(1=NQ,7=ARCA,60=BATS)

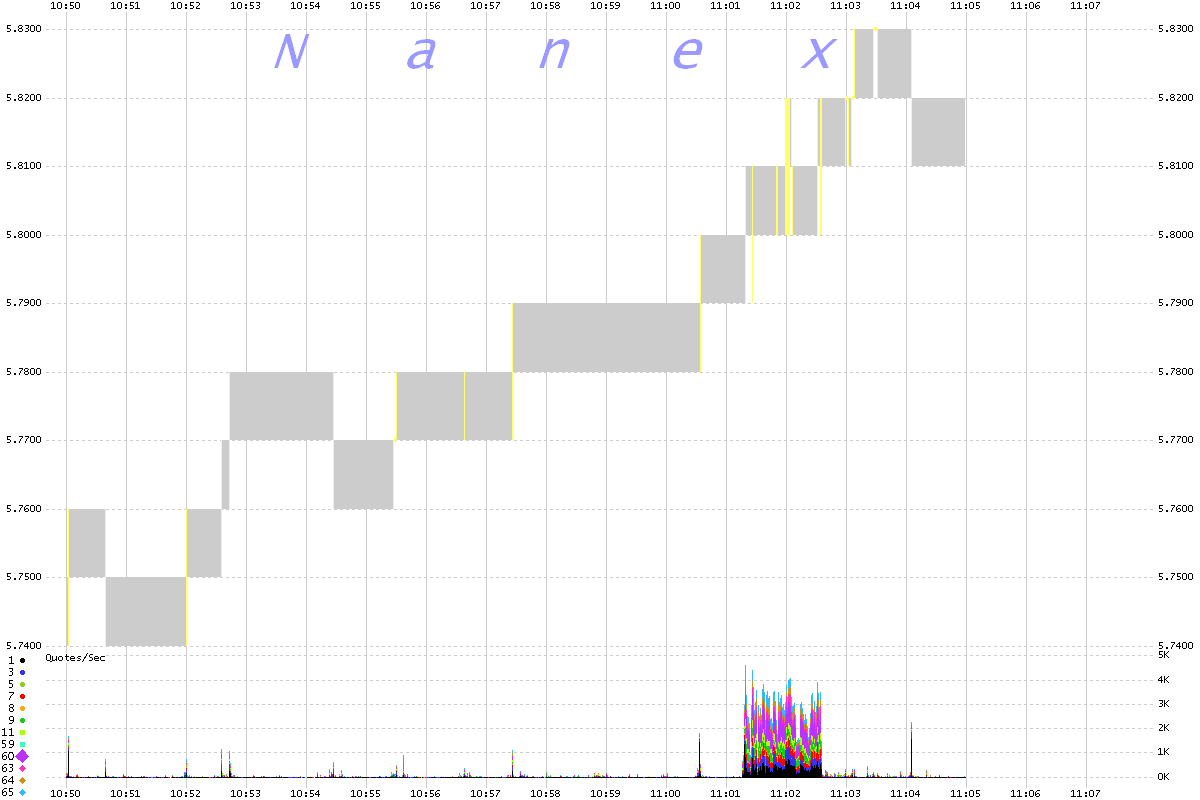
BAC ~ 1 second chart on Dec 9, 2011
Shaded area is BBO. Shows Quote Rate.

BAC ~ 100 millisecond chart on Dec 9, 2011
Circles are trades. Shaded area is BBO

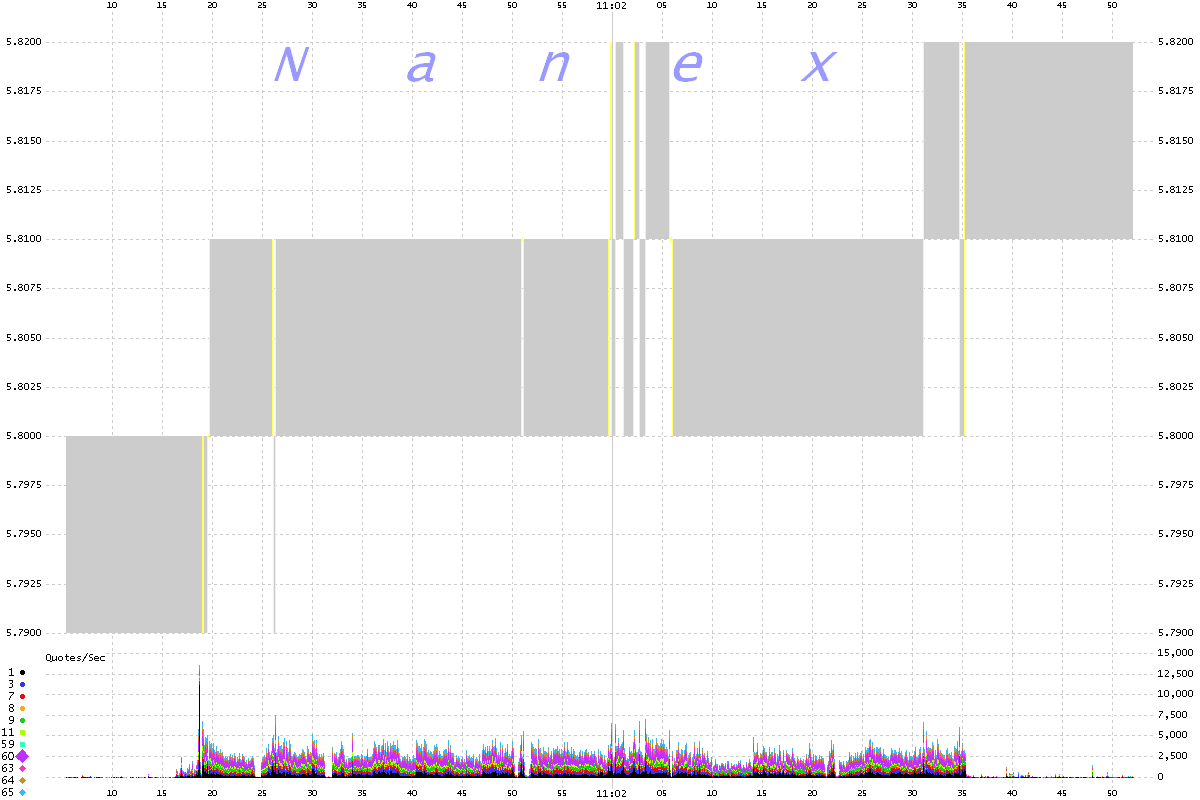
BAC ~ 100 millisecond chart on Dec 9, 2011
Shaded area is BBO. Shows Quote Rate.

Nanex Research


