Nanex Research
Nanex ~ HFT Algoritms Running Wild.
We have found many more examples of HFT algos running out of control since our recent
discovery of algo tests occurring during active regular trading hours. We now
know that there are thousands of similar
events every trading day: we missed many of
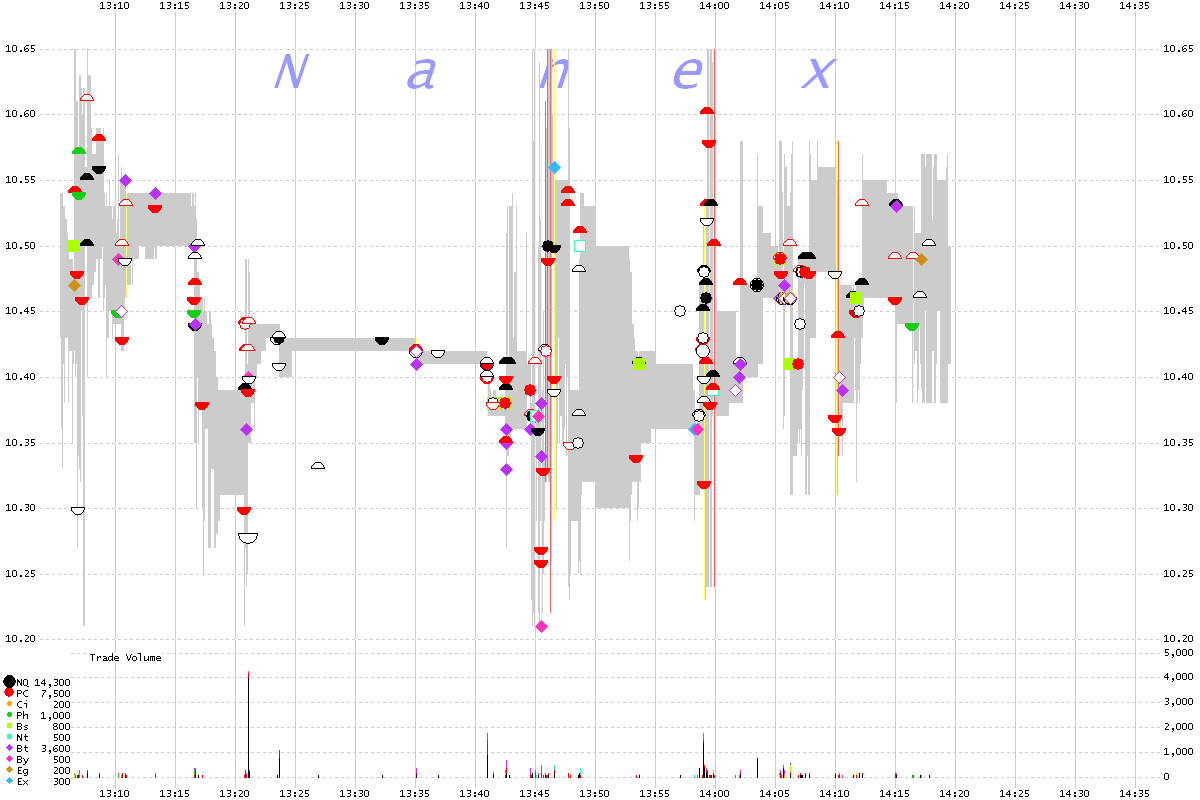
these because our filter parameters were set too high. In the example below, you can see how much it affects prices investors receive. HFT proponents would like you to
believe the spread of CARB is 5 cents or less (the quiet period between 13:25 and
13:40) And they are right! The spread is
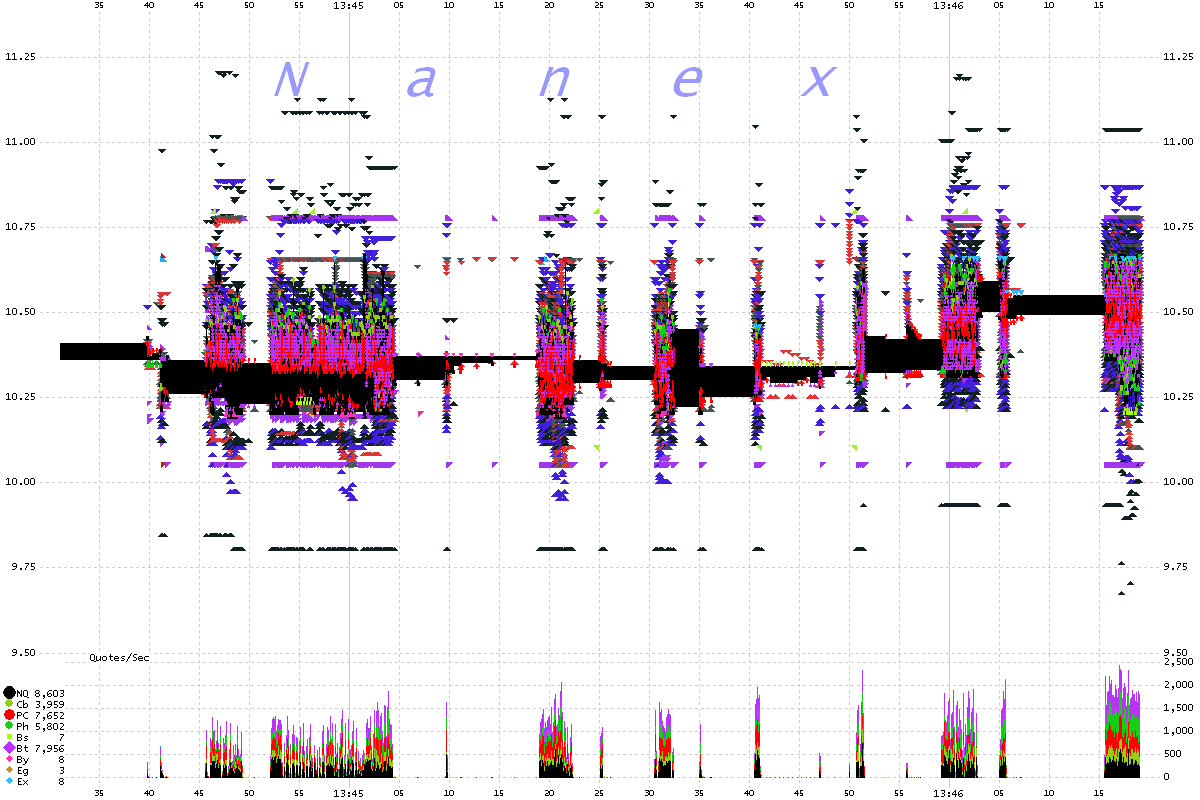
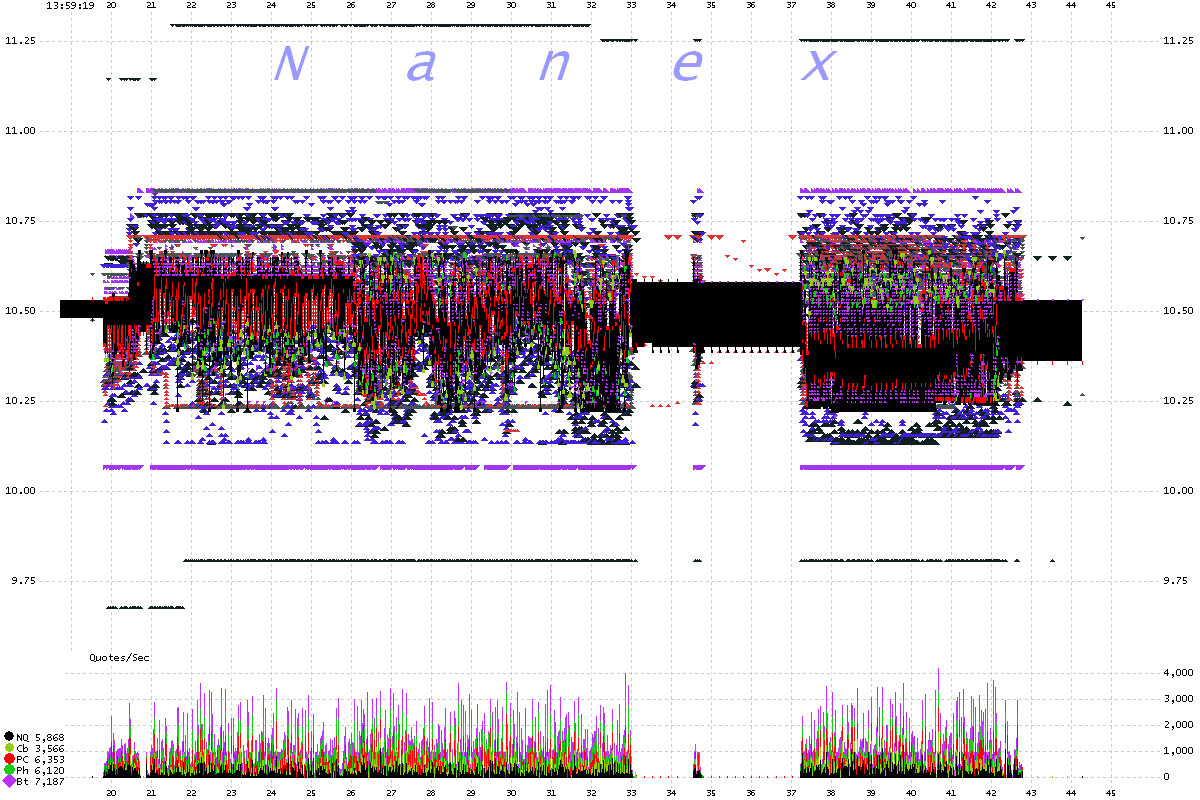
narrow.. when there isn't any trading activity. But once there
is a hint of trading activity, the BBO oscillates to such a degree that it has no
meaning. It might as well be infinite.
Another example of wild HFT algos
running in Google about the same time.
It is time to put an end to this outrageous and blatant price manipulation.
CARB on January 12, 2012 (5 second intervals) Gray shaded area is
the NBBO. Circles are trades. Color coded by Exchange (legend at bottom left).
CARB on January 12, 2012 (1 second intervals) Black shading is the
NBBO. Triangles are bids and offers color coded by exchange (legend at bottom left)
CARB on January 12, 2012 (100 millisecond intervals)
CARB on January 12, 2012 (1 millisecond intervals, chart shows about
1 second of data)
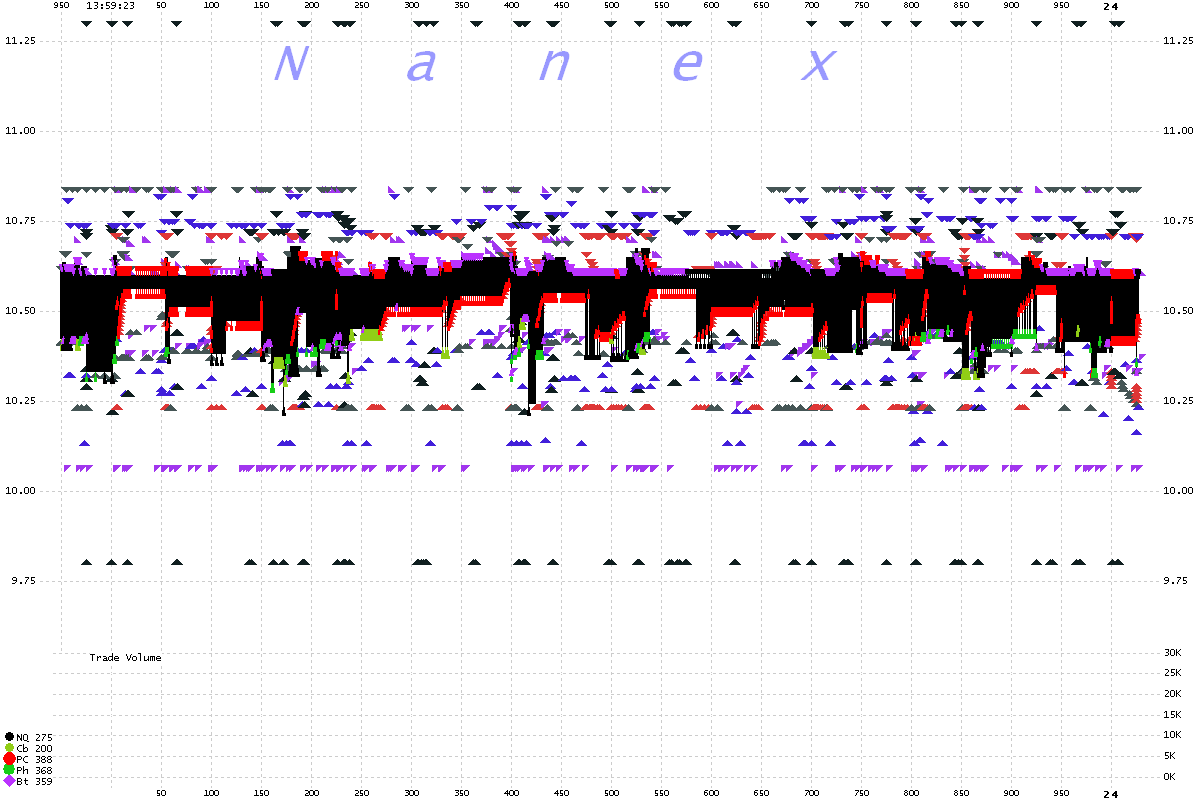
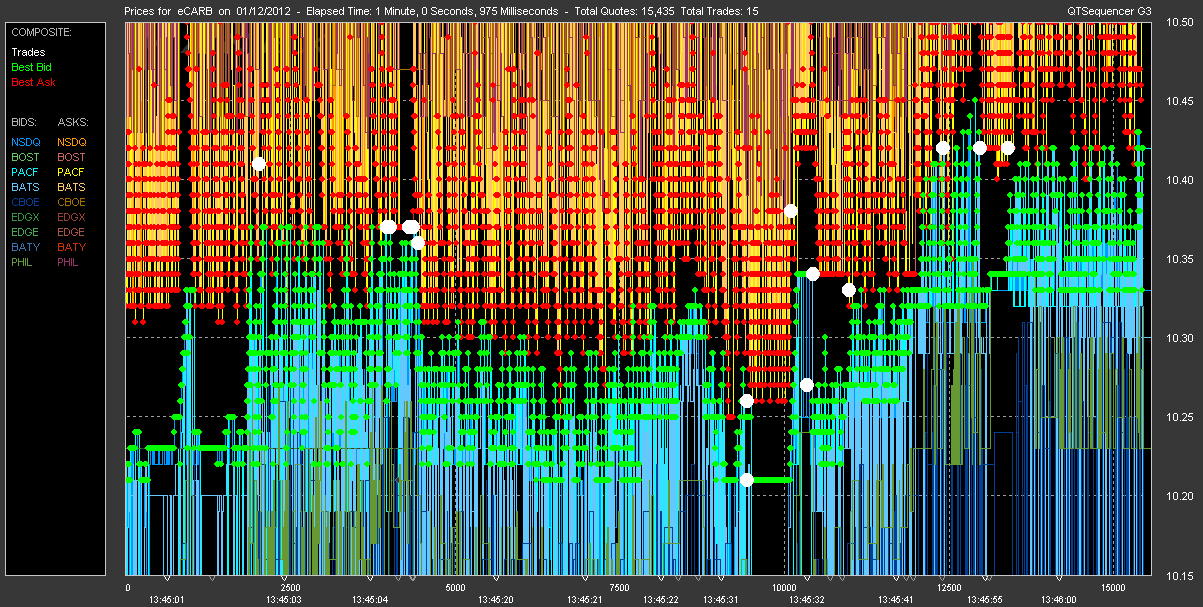
CARB on January 12, 2012 (tick chart)
