Nanex Research
Nanex ~ HFT Algoritms Running Wild in Apple.
HFT algorithms have been running wild in Apple (AAPL), causing massive quote message
traffic and wreaking havoc on exchange routing software. Today we drilled down into
this mountain of data and found clear examples of manipulation. It appears this algorithm
sends a flood of orders from multiple exchanges in an effort to overwhelm or confuse
other algorithms or human traders. Sometimes this results in crossed quotes from one
of the 9 exchanges which then triggers a cascade of trade executions
The NYSE and NYSE-Arca have
recently proposed rule changes that would formally make this activity illegal.
A
recent article in Reuters indicates the SEC is finally acknowledging the negative
impact of this behaviour.
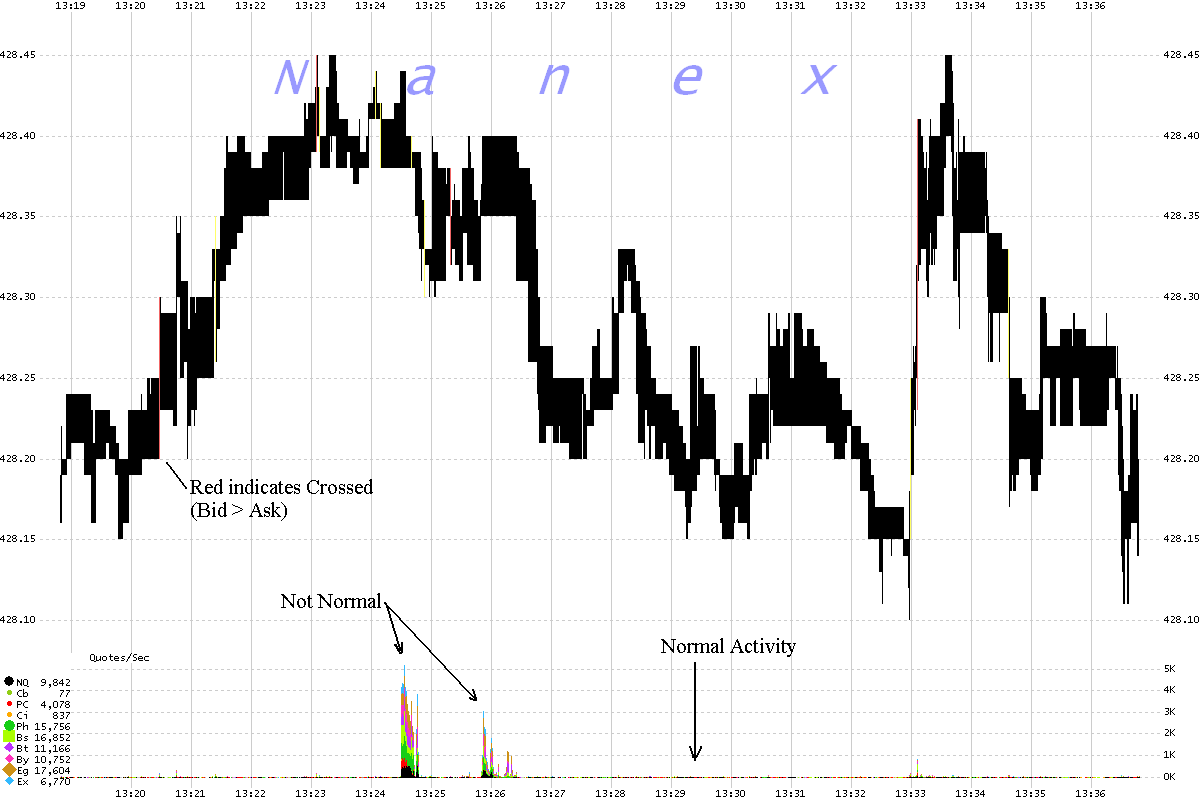
AAPL on January 18, 2012 (1 second intervals). This chart shows 18 minutes
of data. The NBBO is the shaded area and colored black to indicate a
normal market (bid < ask), yellow for a locked market (bid = ask), or red for a
crossed market (bid > ask). The quote traffic is shown in the bottom panel.
Note the absurdly high rate marked "Not Normal".
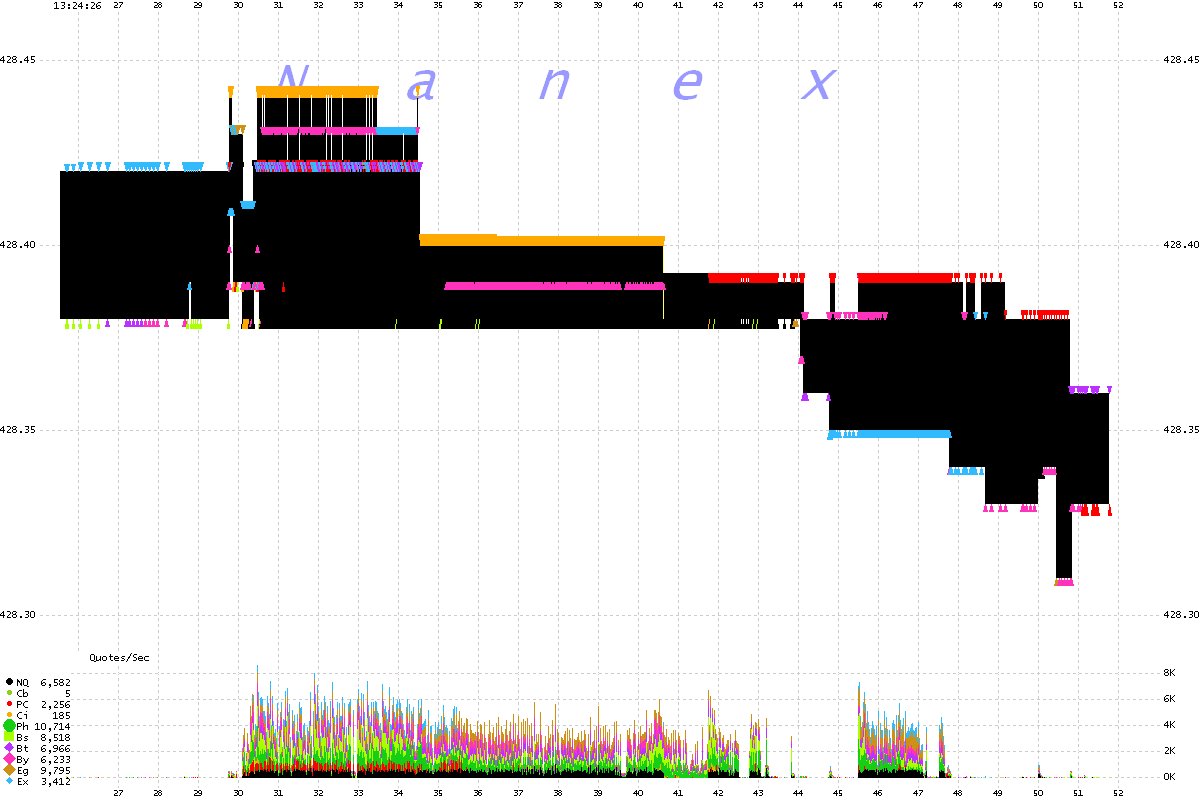
AAPL on January 18, 2012 (25 millisecond intervals). This chart shows
26 seconds of data. Black shading
is the NBBO. Triangles represent the National Best
Bid and Offer and are color coded by exchange (legend at bottom left). Note the wild oscillations in both the Best Bid (bottom of black shade) and
Best Offer (top of black shade).
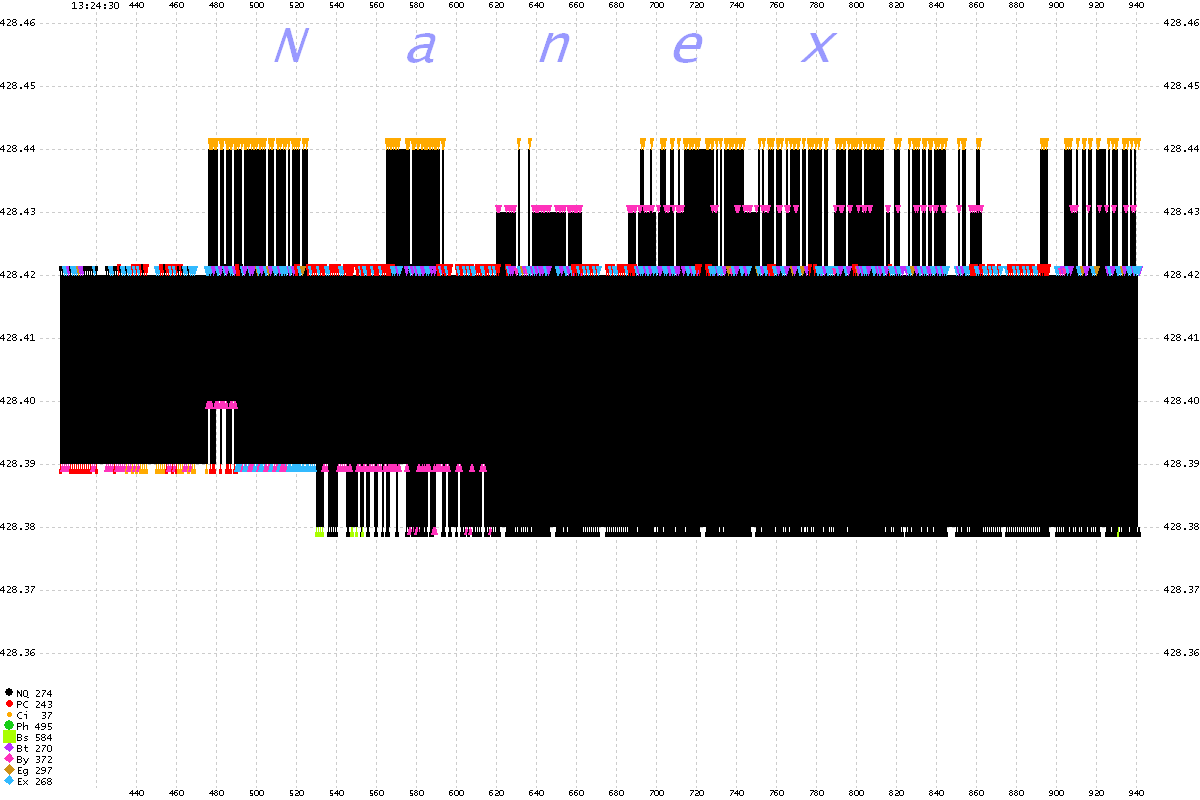
AAPL on January 18, 2012 (1 millisecond intervals) . This chart shows
about 1/2 second of data. Note the magnitude and frequency of NBBO changes -- some
last less a millisecond! Black shading is the NBBO. Triangles
are bids and offers color coded by exchange (legend at bottom left).
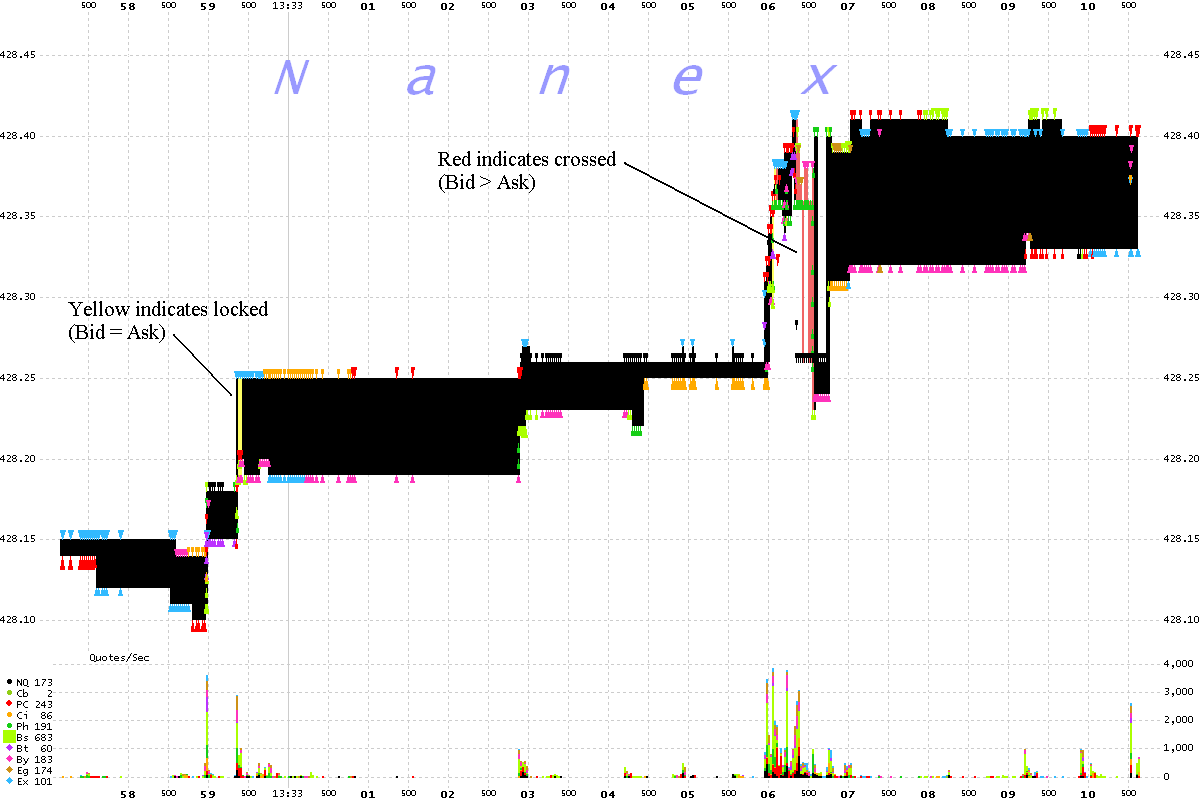
AAPL on January 18, 2012 (25 millisecond intervals) . This chart shows 13 seconds of data that occurred a few minutes after the surge above.
Note the Red vertical shading indicating the NBBO is crossed which indicates an abnormality.
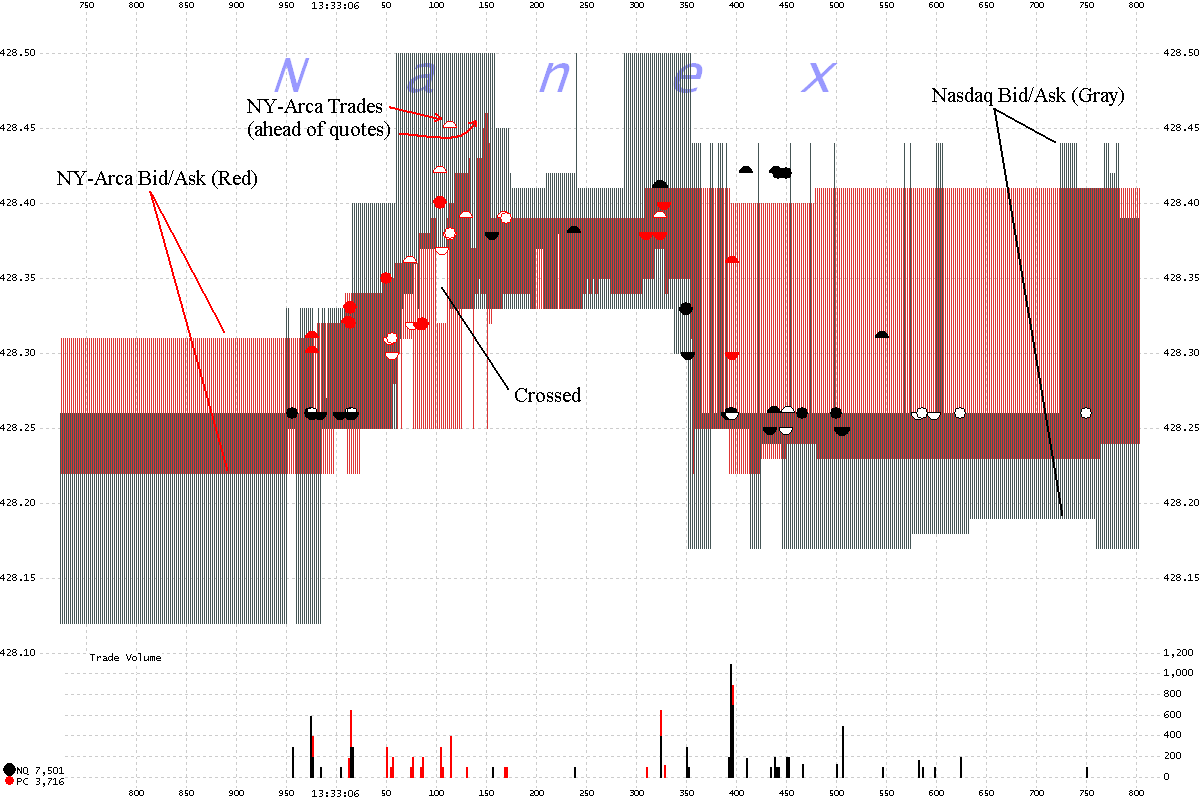
AAPL on January 18, 2012 (2 millisecond intervals). This chart shows
about 1 second of data. Only 2 exchanges are shown for clarity.
Note that where the market is crossed, a NY-Arca trade appears 35 ms ahead of the
only quote that could have caused it.
Also note the truly crazy spikes in the Nasdaq quote starting around 13:33:06:400
-- the ask flutters from 428.26 to 428.44 in a millisecond or two.
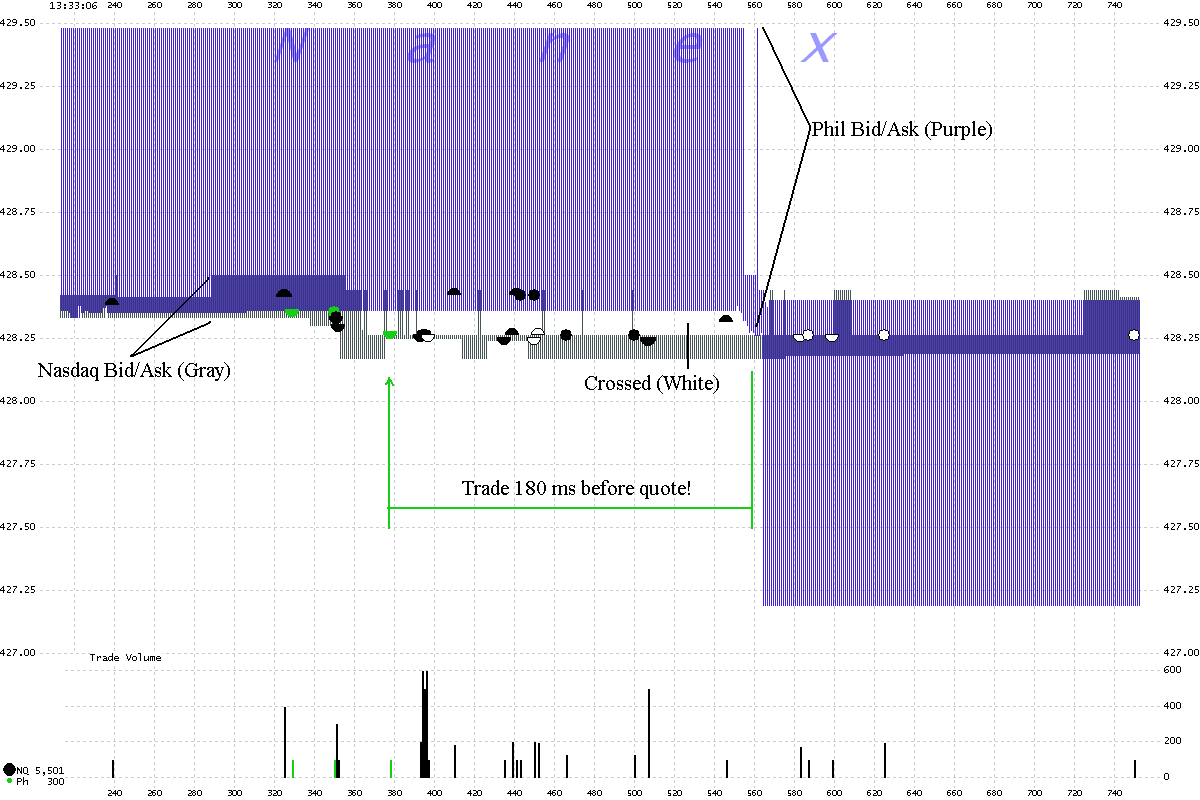
AAPL on January 18, 2012 (1 millisecond interval) . This chart shows
1/2 second of data. Only 2 exchanges are shown for clarity.
Note that where the market is crossed, a Phil. Exg trade (green) appears 180 ms ahead
of the only quote that could have caused it.
Nanex Research


