Nanex
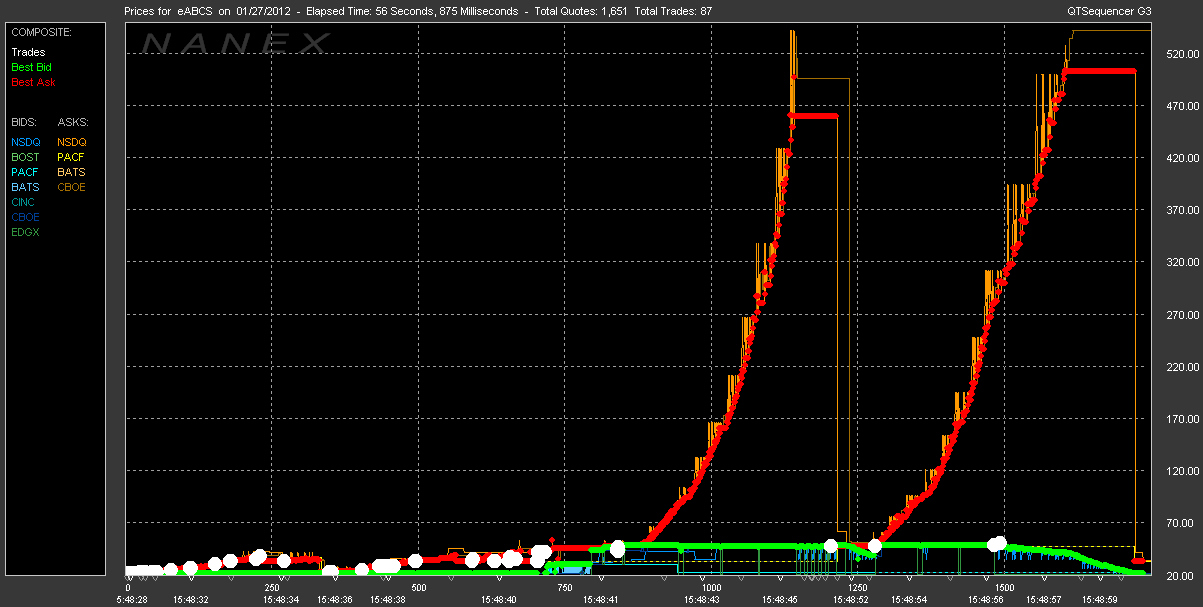
Tick chart of trades and NBBO.
50 millisecond chart of bids and offers. Shaded area is NBBO.
Nasdaq and CBOE offers led the prices higher. The other exchanges had 0 for offer
prices, which may have caused an algo to misread the market. It's good to know they
don't run tests during trading hours.
20 millisecond chart of trades (cicles), bids and offers (triangles). Shaded
area is NBBO.
Nanex
