Nanex
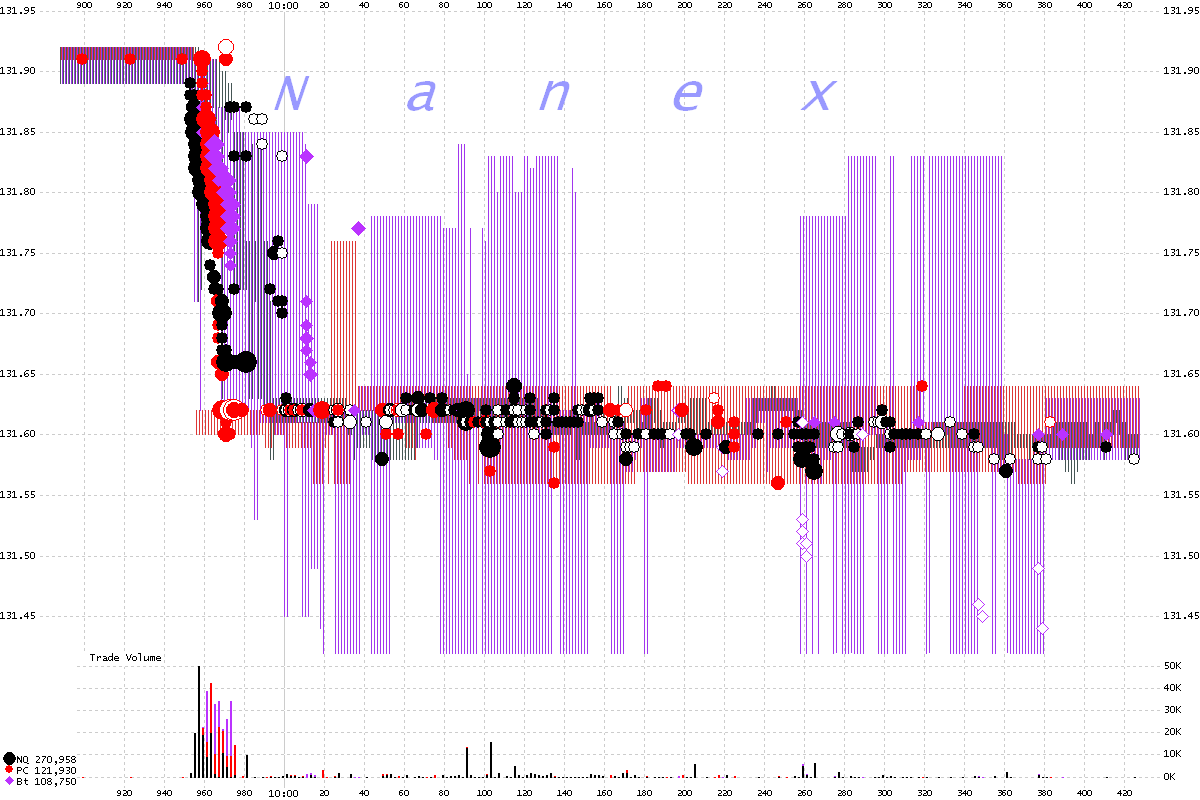
SPY at 10:00 on January 31, 2012 (1 millisecond chart)
Did someone get advanced information on the
consumer confidence number reported at 10:00:00 ? The chart below of the ETF
symbol SPY indicates a news reaction 50 milliseconds before the official news release.
At the same exact time, 1,500 March electronic S&P Futures (eMini) cleared 6 of
the 10 depth of bid quotes. This looks like the work of the
Disruptor, which hits both futures and ETFs simultaneously. Since the futures
trade in Chicago and the equities in New York, there is a speed of light separation
of approximately 14ms. The Disruptor times it so both futures and equities transactions
occur at the same time.
Take a look at the wild swings in the bid/ask spread (color shading)! This chart shows about 1/2 second of data. We show only 3 of the 10 exchanges linked to the NBBO for clarity.

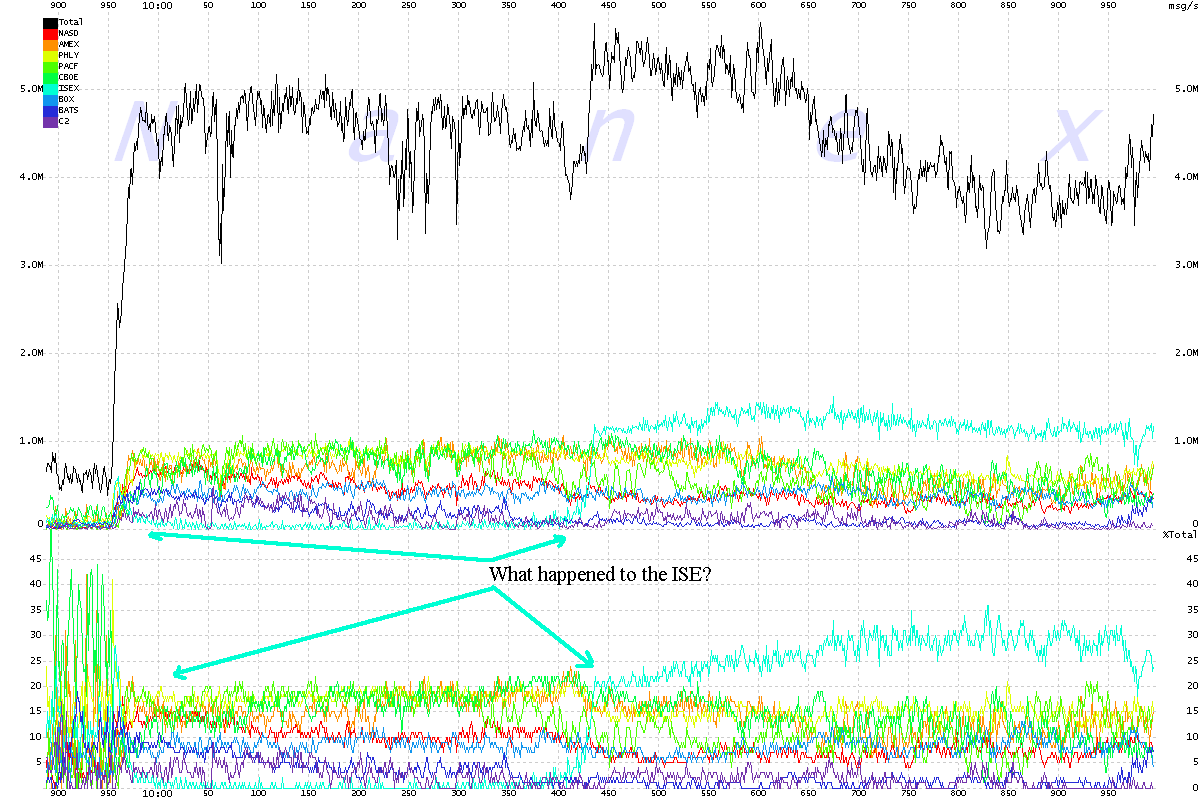
1 Millisecond Chart of Option Quote Message rates by Reporting Exchange
During the eMini/SPY event, Option Quotes from the ISE basically shut down
for almost 1/2 second. Look at the cyan colored line below.. We've seen this
anomaly before from the ISE, but never for this long.

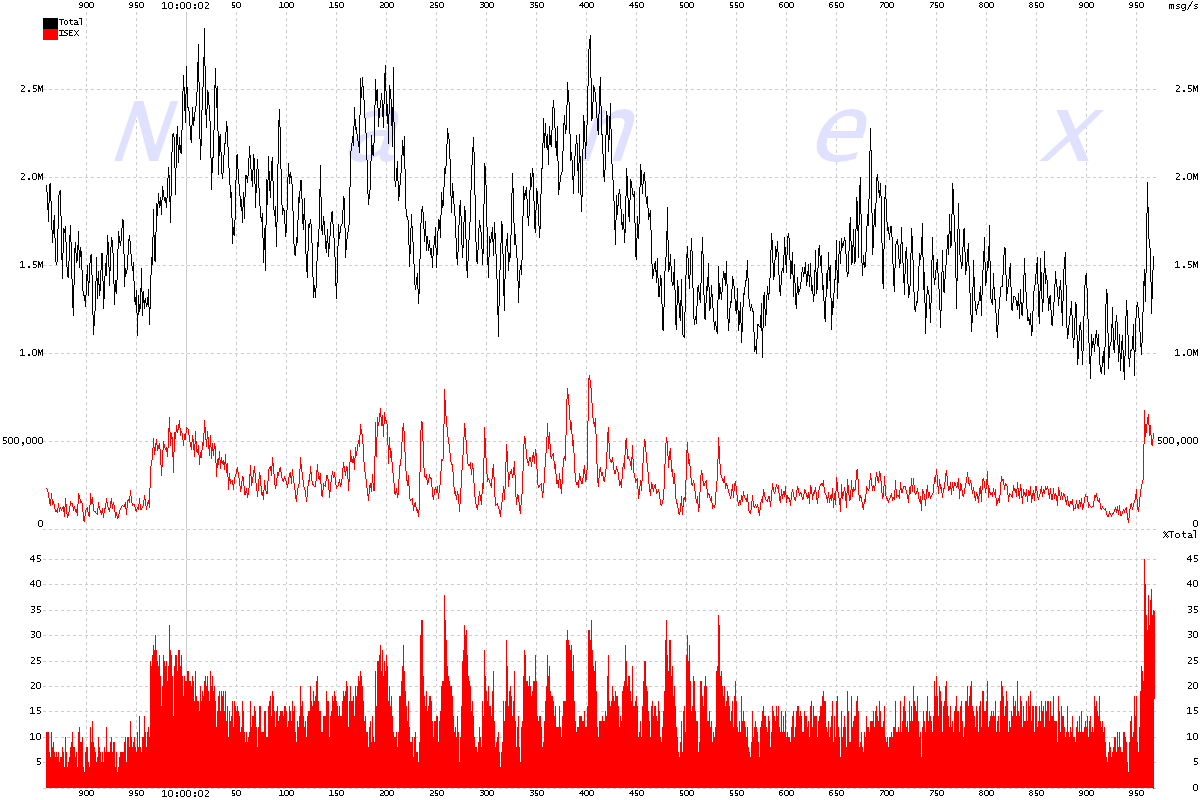
1 Millisecond Chart of Option Quote Message rates from the ISE
About 2 seconds after the ISE shut down event, quotes from the ISE began
oscillating which is usually a good indication of network saturation.

Nanex


