Nanex
NYSE Amex had a few crossed stocks for approximately 15 minutes and 45 seconds: between
13:38:15 and 13:54pm.
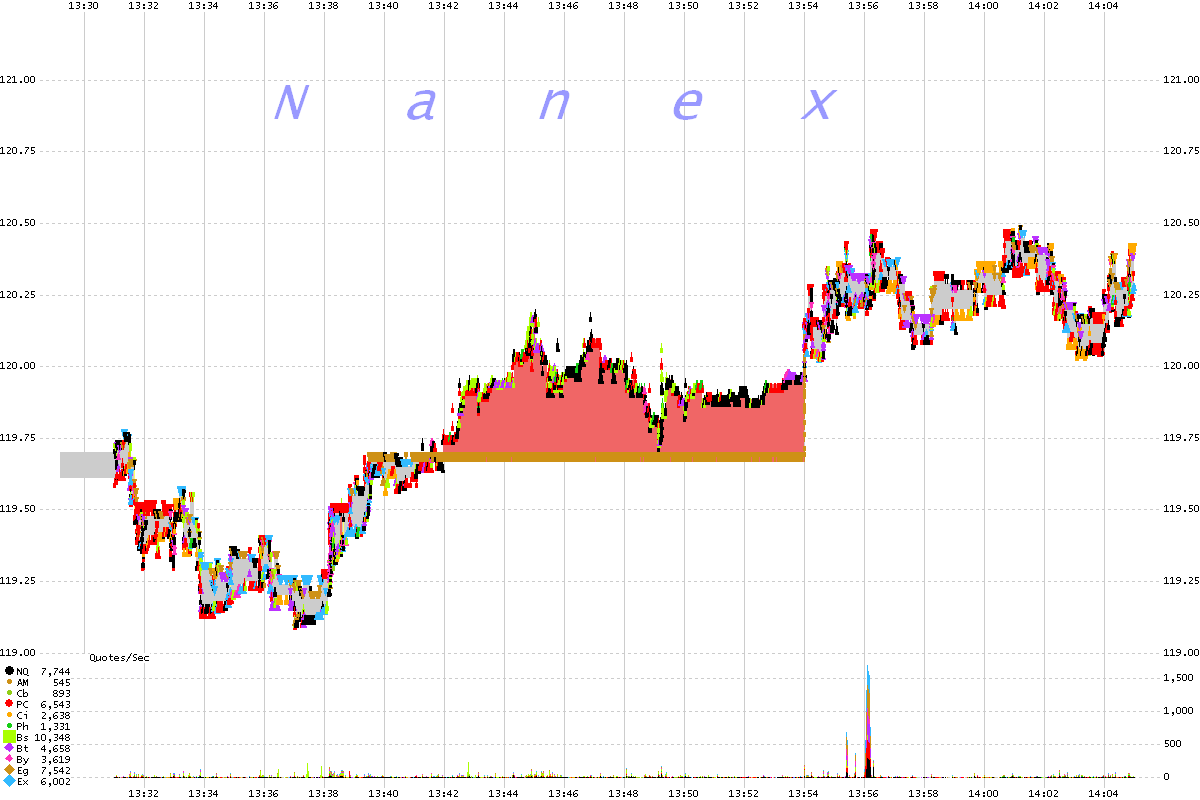
NFLX on January 31, 2012 (5 second chart)
The red shading indicates a crossed market. The gold band along the bottom shows the
stuck AMEX offer way below the Best Bid.

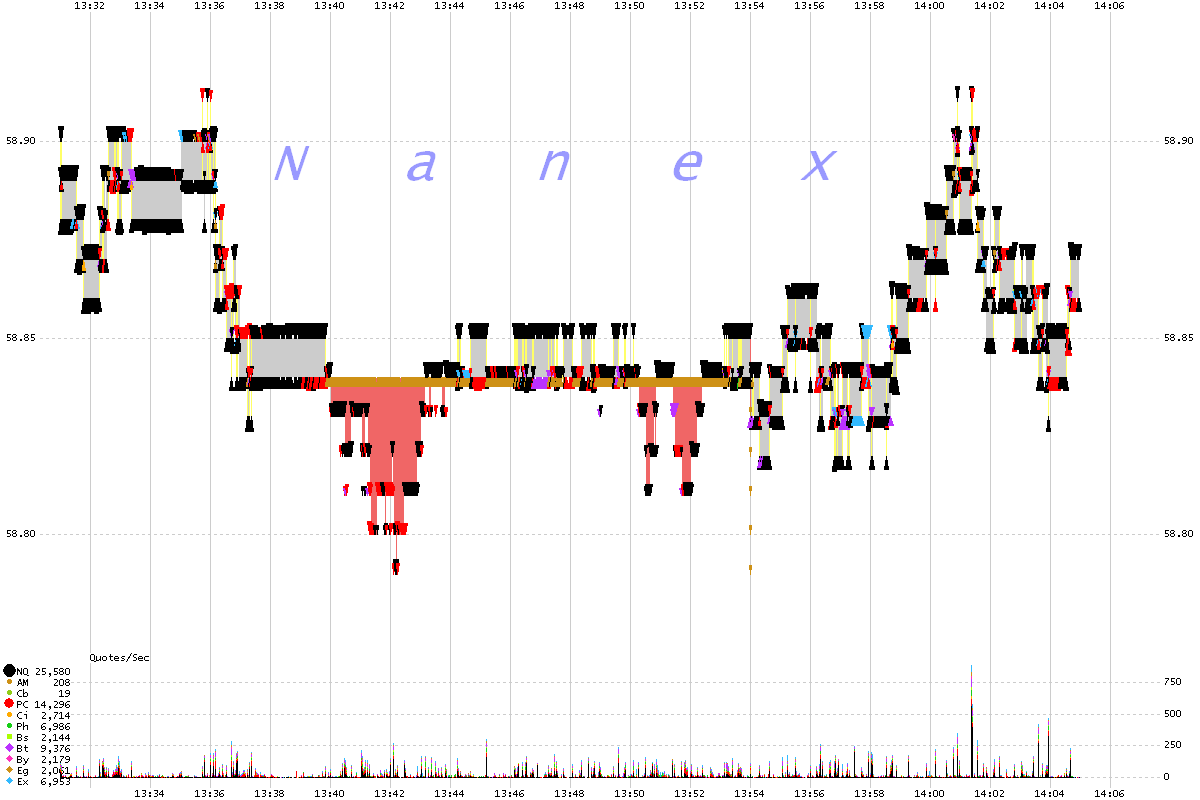
QCOM on January 31, 2012 (5 second chart)
The red shading indicates a crossed market. The gold band along the top of the red
shading shows the stuck AMEX bid way above the Best Offer.

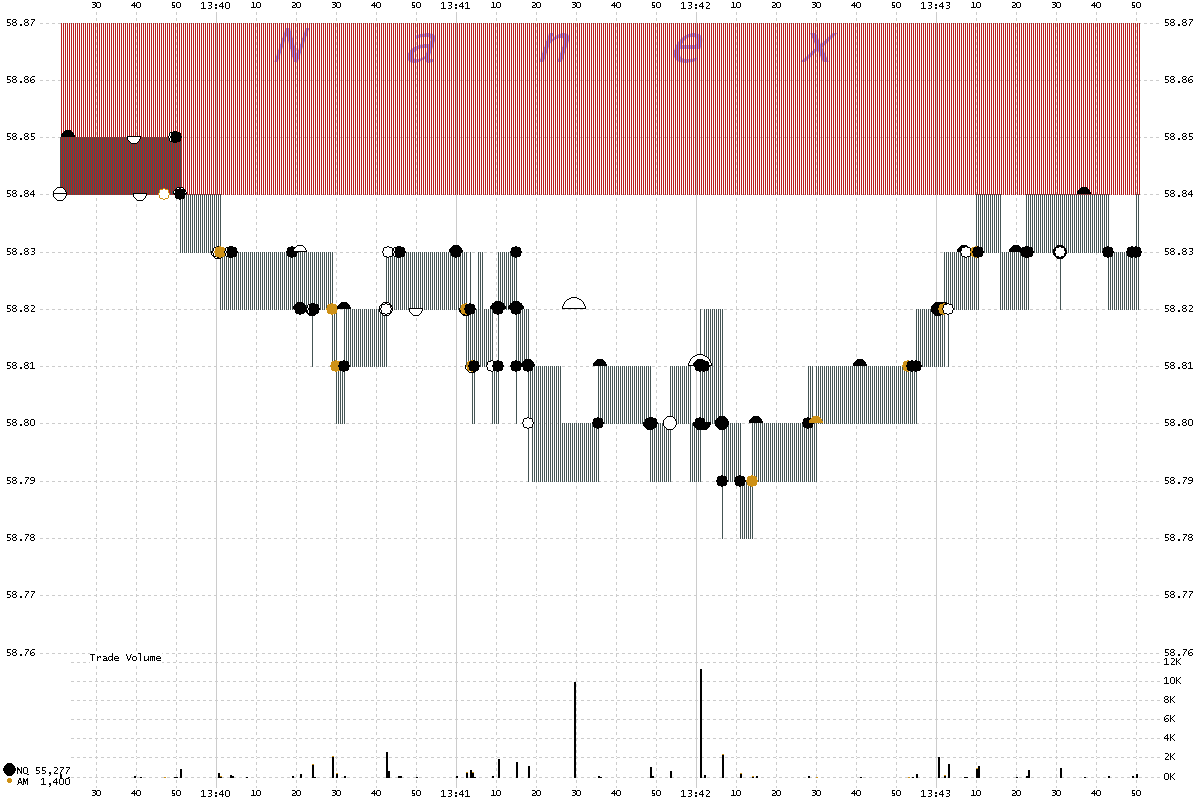
QCOM on January 31, 2012 (2 second chart)
The chart below shows the quote spread (shading) and trades from just 2 exchanges Nasdaq, which was operating normally, and AMEX which was not.
Except, AMEX didn't seem to have any problems executing trades (gold dots) outside
of their published Bid and offer (red shading). Must be for direct feed, exclusive
members only.


