Nanex Research
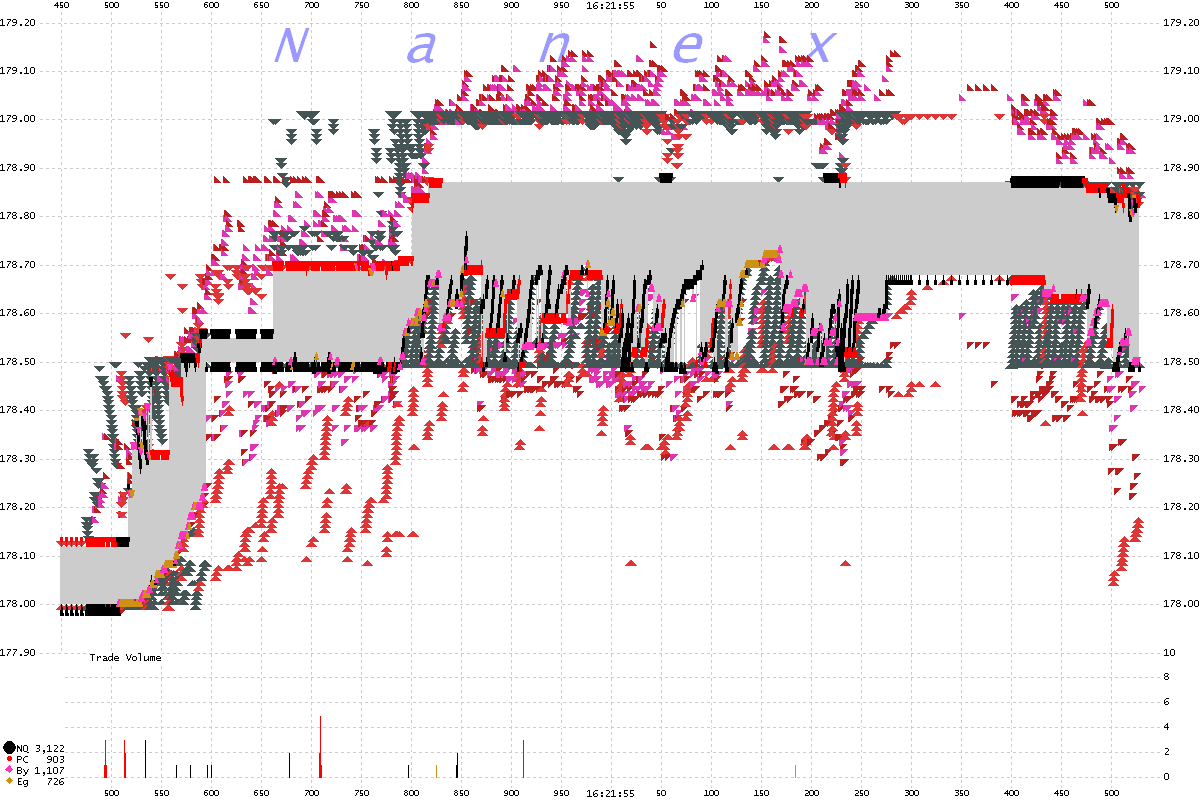
Amazon (AMZN) after hours madness on January 31, 2012
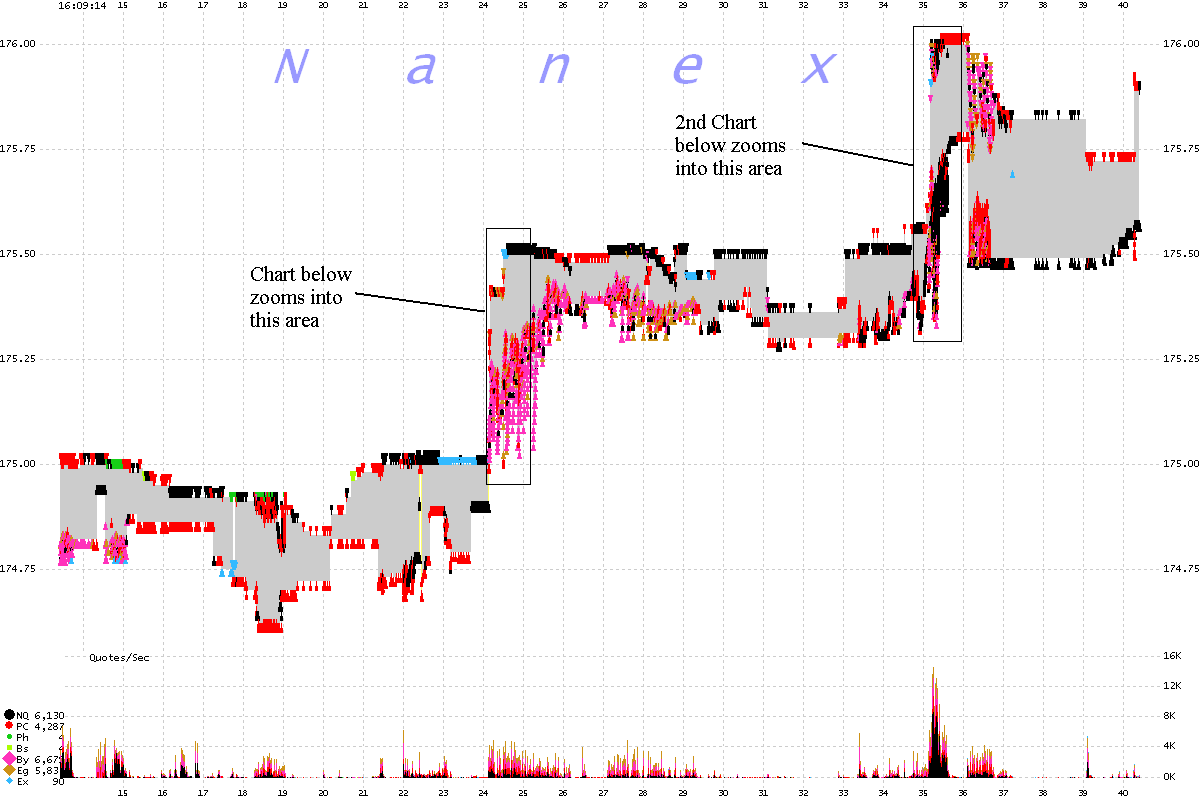
AMZN (25 millisecond chart) The chart below shows about 26 seconds
of data. There are over 20,000 quotes shown, color coded by exchange according to
the legend in the bottom left corner.
The NBBO is the vertical shading: gray for a normal market (bid < ask), yellow
for a locked market (bid = ask), or red for a crossed market (bid > ask).
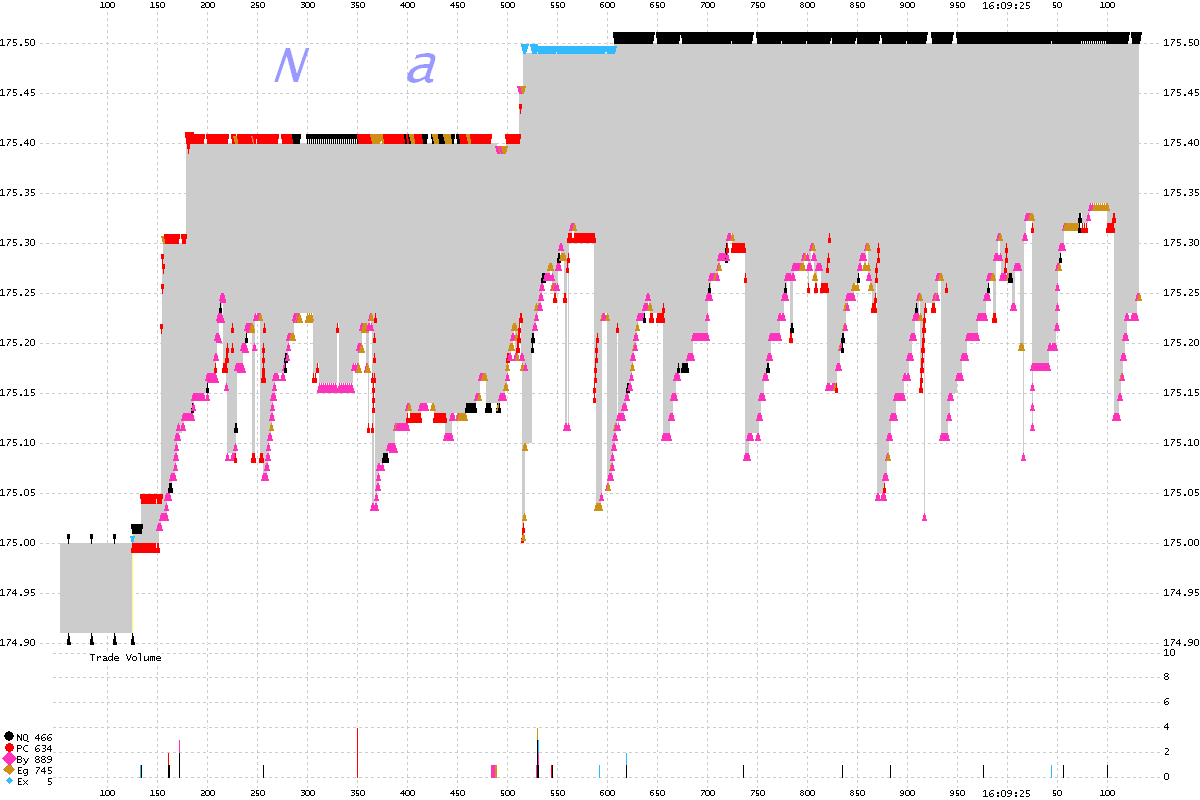
AMZN (1 millisecond chart) Zoom of above. The chart below shows 1
second of data. Best bids and offers are triangles color coded by exchange according
to the legend in the bottom left corner.
The NBBO is the vertical shading: gray for a normal market (bid < ask), yellow
for a locked market (bid = ask), or red for a crossed market (bid > ask). Bids
are below the shading, Asks are above.
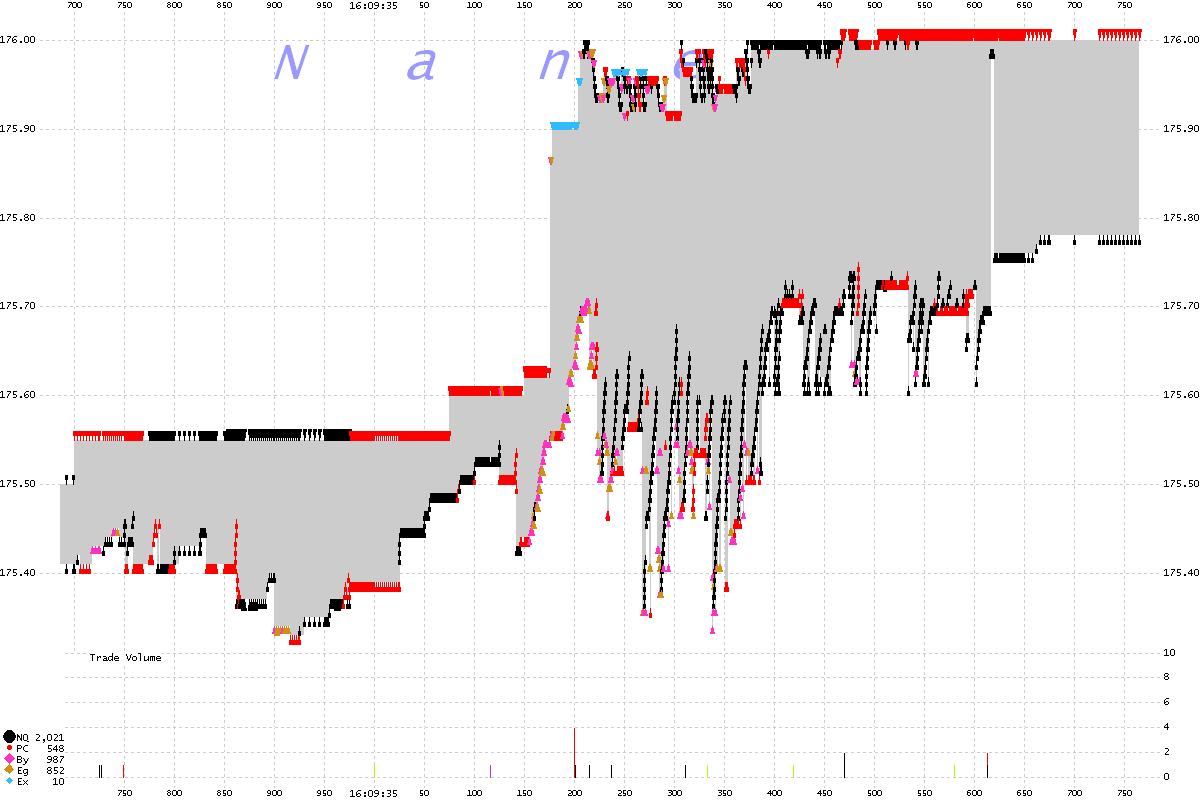
AMZN (1 millisecond chart) Zoom 2 of above. The chart below shows
1 second of data. Best bids and offers are triangles color coded by exchange according
to the legend in the bottom left corner.
The NBBO is the vertical shading: gray for a normal market (bid < ask), yellow
for a locked market (bid = ask), or red for a crossed market (bid > ask). Bids
are below the shading, Asks are above.
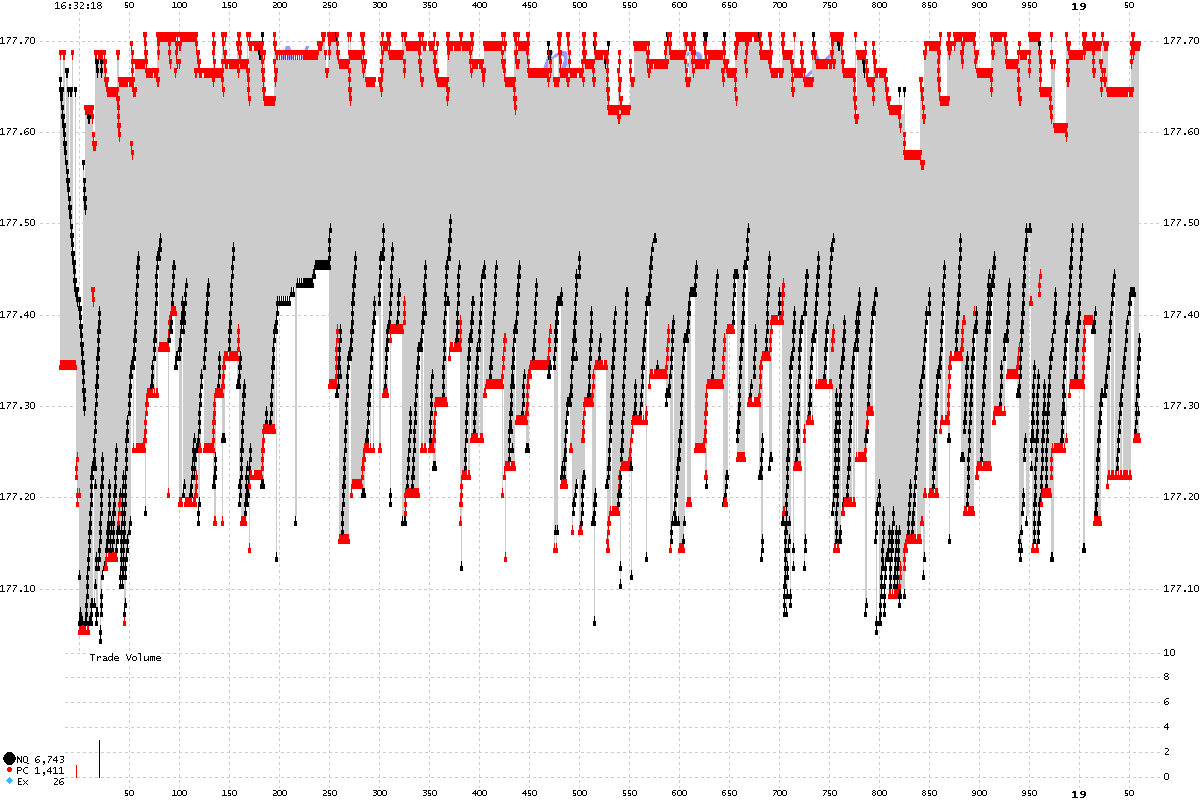
AMZN (1 millisecond chart) Another example. The chart below shows
1 second of data. Best bids and offers are triangles color coded by exchange according
to the legend in the bottom left corner.
The NBBO is the vertical shading: gray for a normal market (bid < ask), yellow
for a locked market (bid = ask), or red for a crossed market (bid > ask). Bids
are below the shading, Asks are above.
AMZN (25 millisecond chart) Another example. The chart below shows
26 seconds of data. Best bids and offers are triangles color coded by exchange according
to the legend in the bottom left corner.
The NBBO is the vertical shading: gray for a normal market (bid < ask), yellow
for a locked market (bid = ask), or red for a crossed market (bid > ask). Bids
are below the shading, Asks are above.
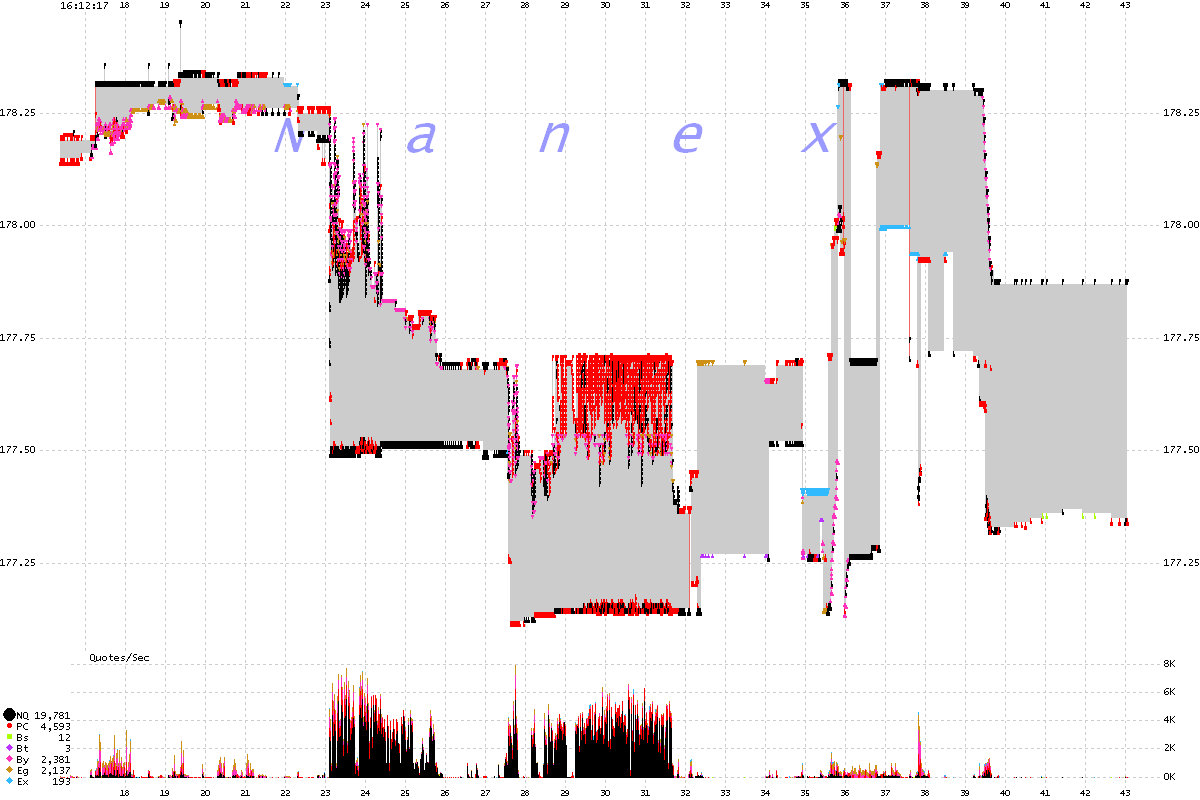
AMZN (25 millisecond chart) Another example, includes non NBBO quotes.
The chart below shows 26 seconds of data. Best bids and offers are triangles color
coded by exchange according to the legend in the bottom left corner.
The NBBO is the vertical shading: gray for a normal market (bid < ask), yellow
for a locked market (bid = ask), or red for a crossed market (bid > ask). Bids
are below the shading, Asks are above.
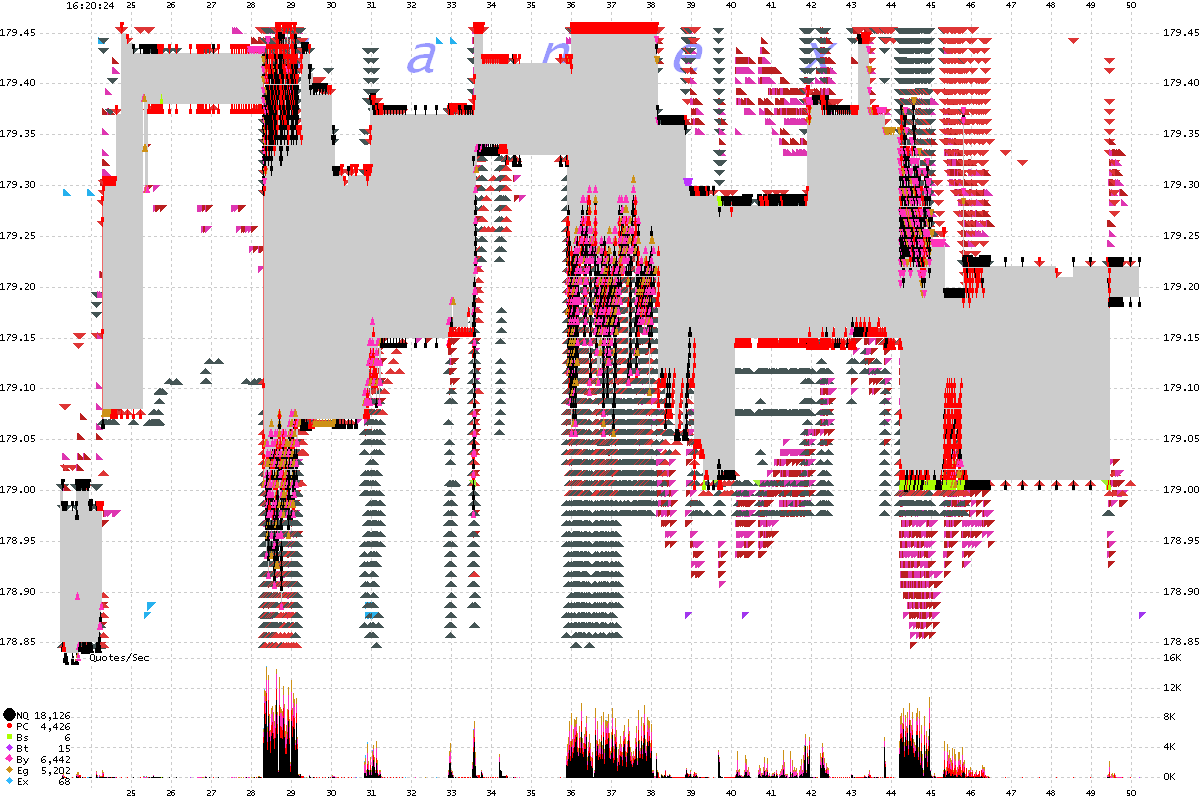
AMZN (25 millisecond chart) Another example, includes non NBBO quotes.
The chart below shows 26 seconds of data. Best bids and offers are triangles color
coded by exchange according to the legend in the bottom left corner.
The NBBO is the vertical shading: gray for a normal market (bid < ask), yellow
for a locked market (bid = ask), or red for a crossed market (bid > ask). Bids
are below the shading, Asks are above.
Nanex Research


