Nanex
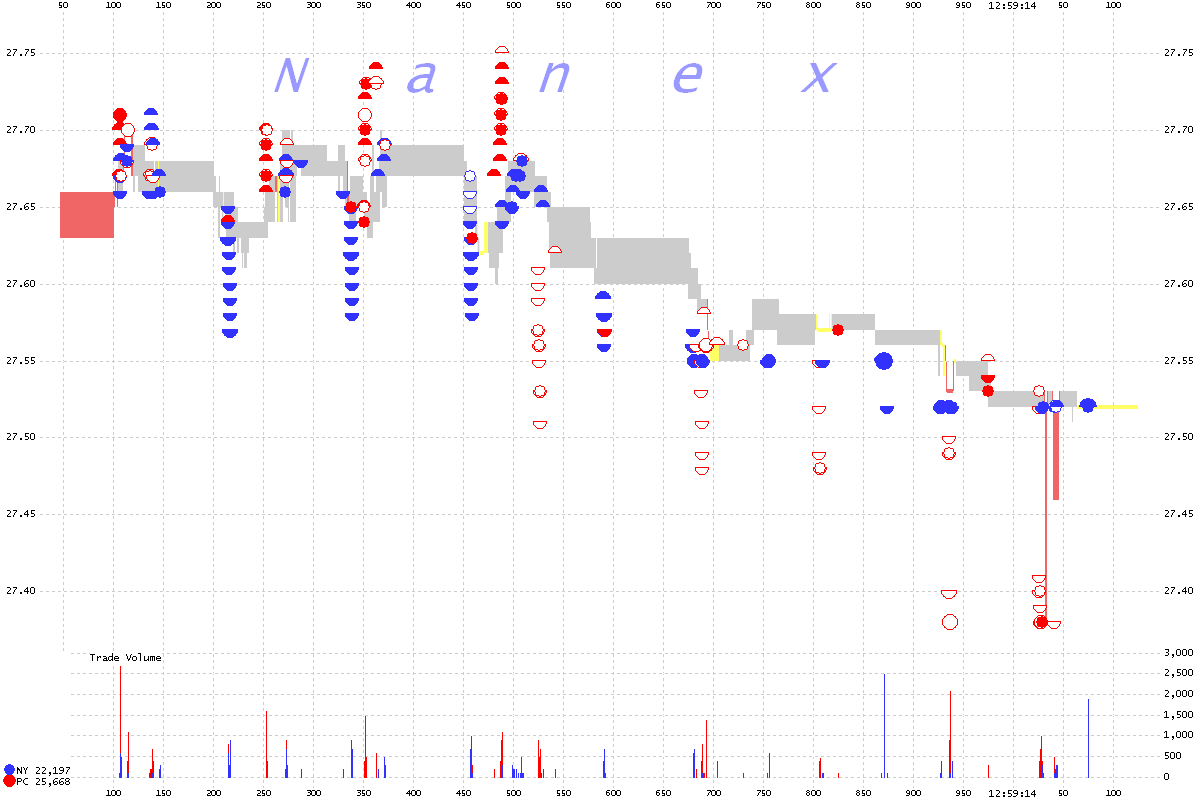
MCP Event on Feb 9, 2012
The 1 millisecond interval chart below shows trades from NYSE (blue circles)
and NYSE-ARCA (red circles) along with the
NBBO (shaded gray for normal, yellow for locked, or red for crossed).
Note the unusual and aggressive pattern of selling at NYSE, then buying at ARCA and
finally selling at both exchanges. All far outside the NBBO. It reminds us of the odd event in the Natural
Gas Market last June. Or the
Whac-A-Mole event.

Nanex


