More Nanex Research

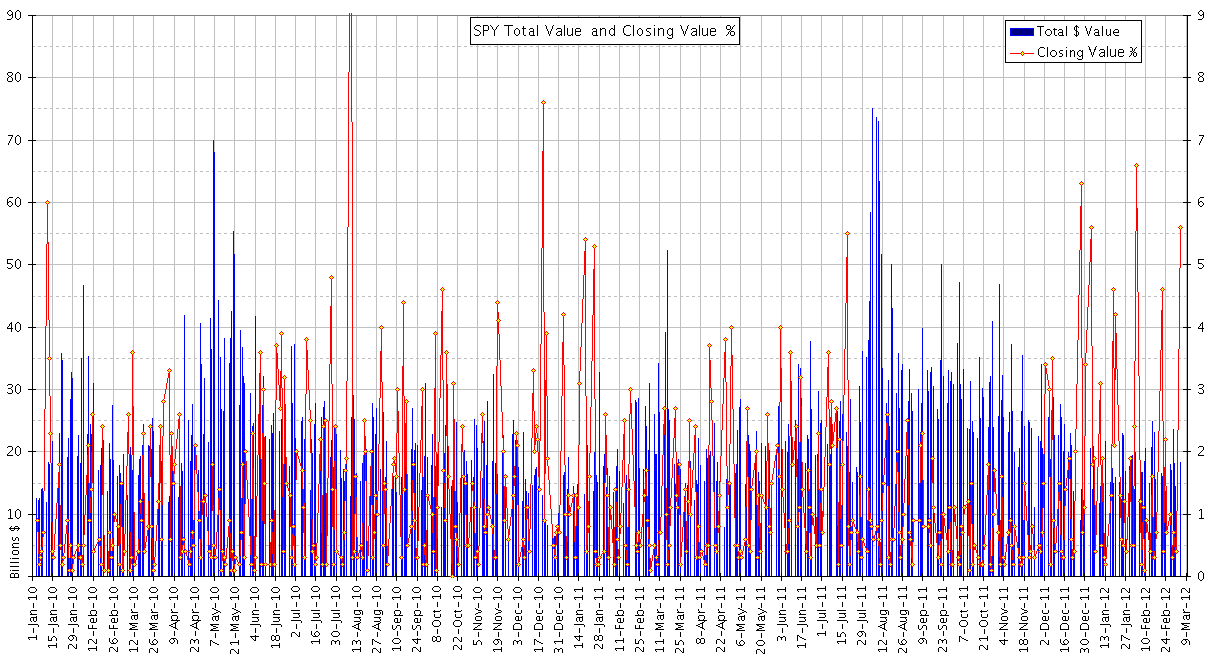
SPY Total Market Value and the percentage of value coming from Market on Close trades between January
1, 2010 and March 5, 2012.
For each day for the stock SPY, divide the total market value (sum of trade
price * trade size) of MOC trades (trade condition Market Closing)
by the total market
value of all trades and plot as a percentage along
with the total market value of all trades.

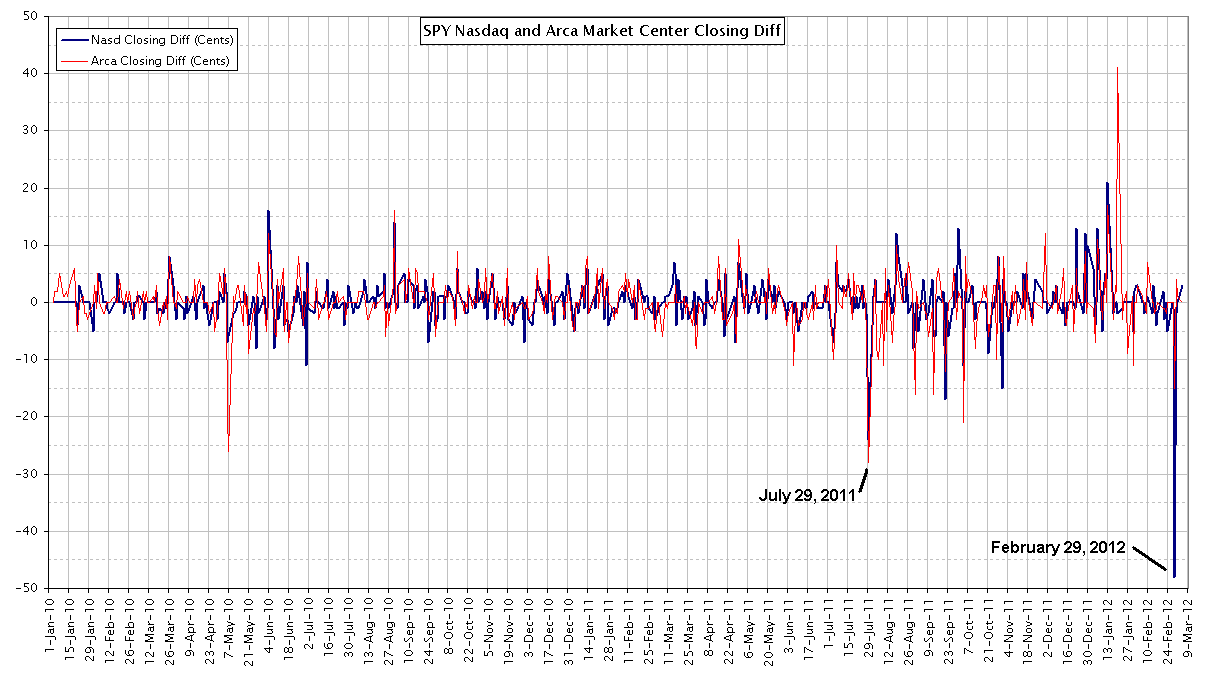
SPY ~ prices of Nasdaq and Arca Market Center Closing trades versus price
of last trade eligible to set last between
January 1, 2010 and March 5, 2012.
The chart below shows the net differences between prices for trade condition Market
Center Official Close, and the price of the last trade eligible to set the last from
Nasdaq and Arca in SPY. Detailed charts of the closing on July 29, 2011 and February
29, 2012 (which appear to show similar closing price manipulation) can be viewed here.

