Nanex Research

VIX Index Spike Event on January 25, 2012
Recently there have been frequent spikes in the VIX index such as the ones shown in the
1 minute chart below (there are 4). We drilled down to the underlying data (option prices) used
in calculating the VIX for the spike at 2pm which is circled in yellow.
What we found was that almost all the quotes in the near
term options used in the VIX calculation suddenly widened which causes the spike.
Why this happens is unknown.

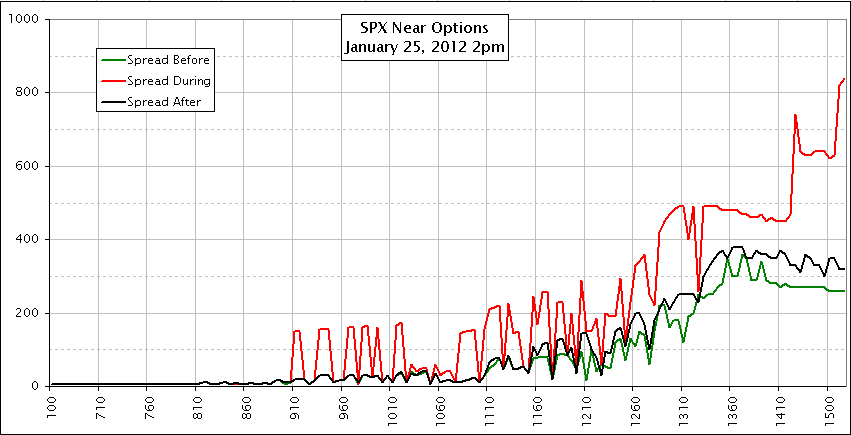
The follow chart shows quote spreads before, during, and after the event for each
near term call option. The X-Axis is strike price and the y-axis is the spread in
cents. Note how the spread widens significantly (red line) during the event in most
strike prices above 900.

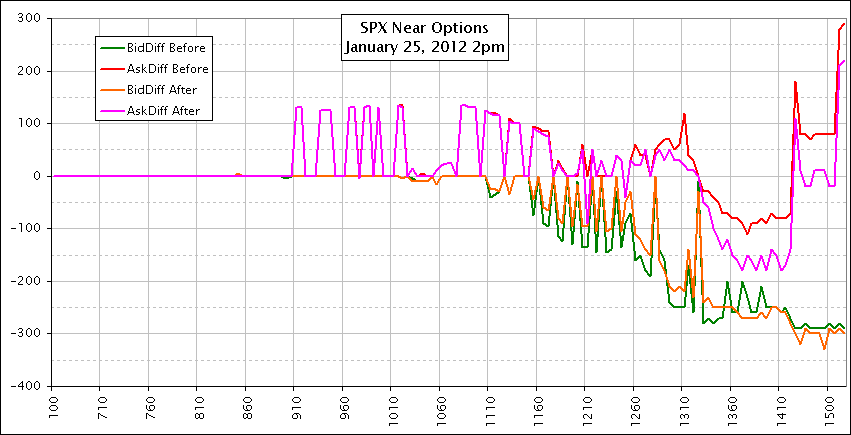
The follow chart is similar to the one above, but shows bid and ask price changes
for each near term call option.

Nanex Research
