Nanex Research

eMini (S&P 500 electronic futures) Depth of Book Recovery
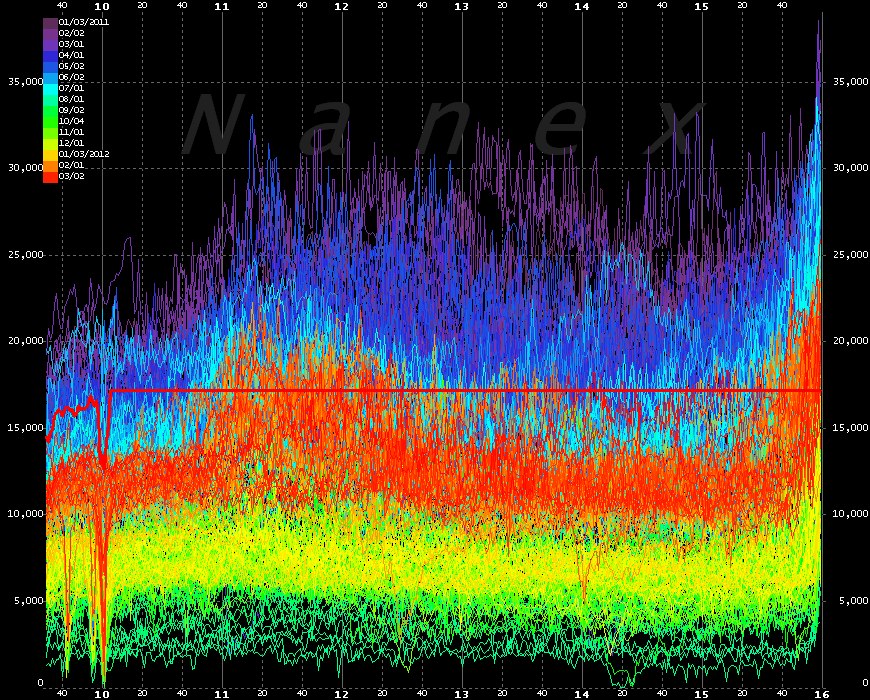
The following chart shows the total number of contracts for all 10 depth of
book levels over each minute of the day between January 1, 2011 (dark purple)
and March 13,2012 at 10:05am (bright red). Older days colored towards the violent
end of the spectrum, while more recent days colored towards the red end. March 13th
showed a significantly higher persistent total. The green at the bottom was August
2011.

Nanex Research

