Nanex Research

March 20, 2012 ~ BATS Trade Blast.
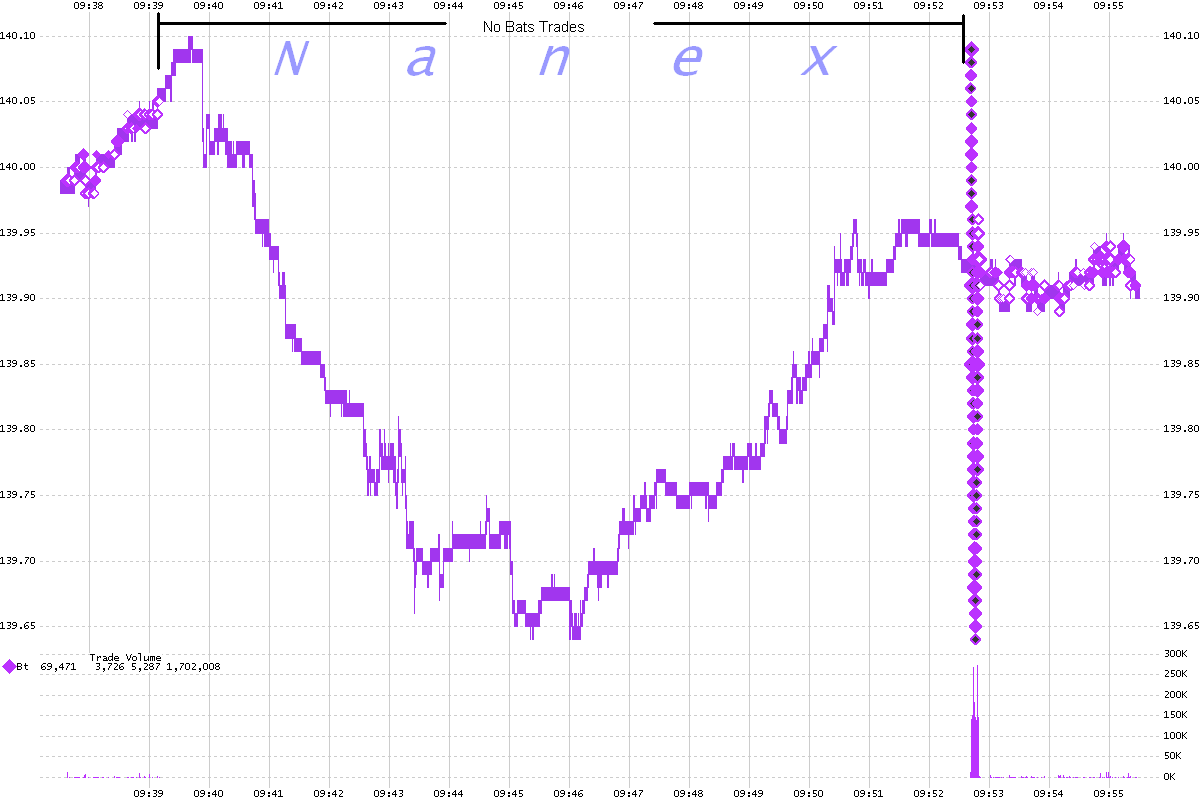
A gap in trade report executions from BATS occurred in many symbols from about 9:39:10 to 9:52:41. At 9:52:41 a sudden explosion of trade report executions from BATS were
blasted across the wires. Looking at the prices, it appears these trades were executed
during the outage, but became stuck in some outbound queue at BATS. However, looking
at the timestamps, one would never know that most of these trades occurred minutes
earlier. The charts below show
the trade gap and subsequent blast of BATS trades in just a few of the symbols we looked at: SPY, AAPL, QQQ, GLD, NFLX and SINA.
SPY 1 second interval chart showing BATS trades (circles) and quote (pink shading).
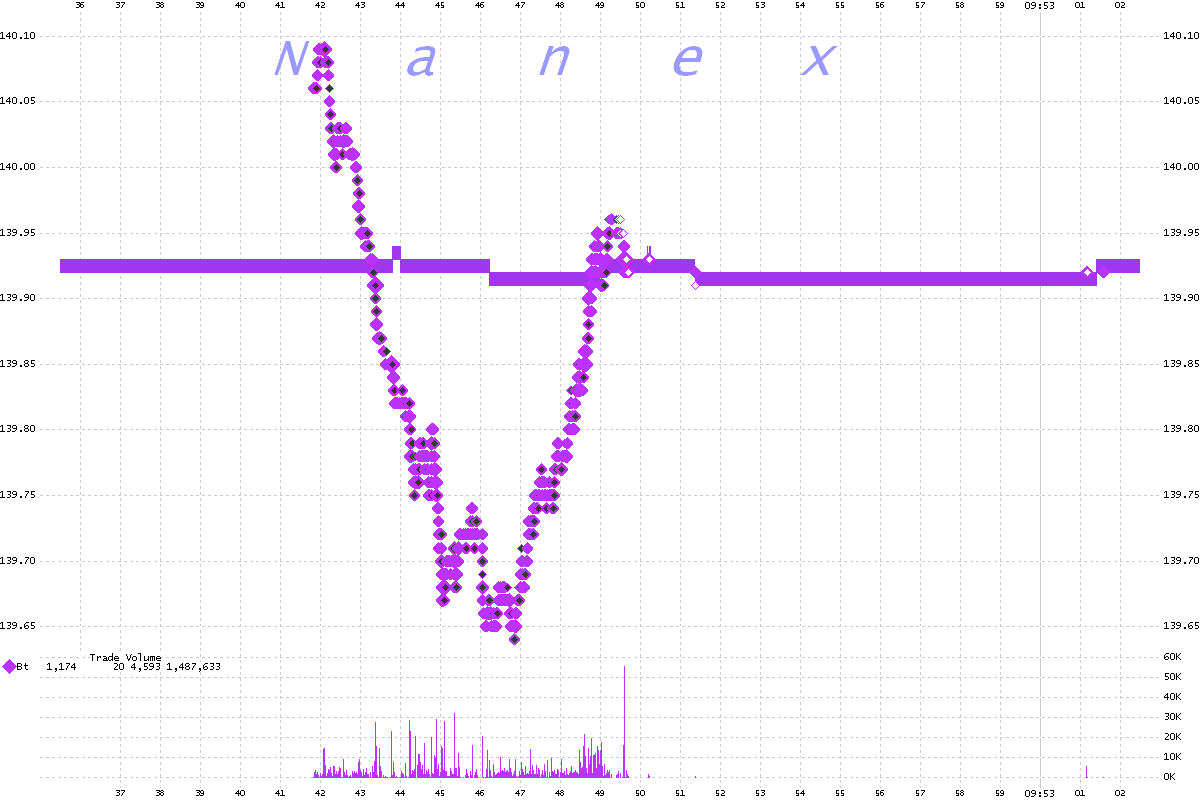
SPY 25 millisecond interval chart. Note how far away the trades (circles) are from
the quote (pink shading). You can clearly see the price pattern matches the market
for the period of time that BATS trades were not sent.
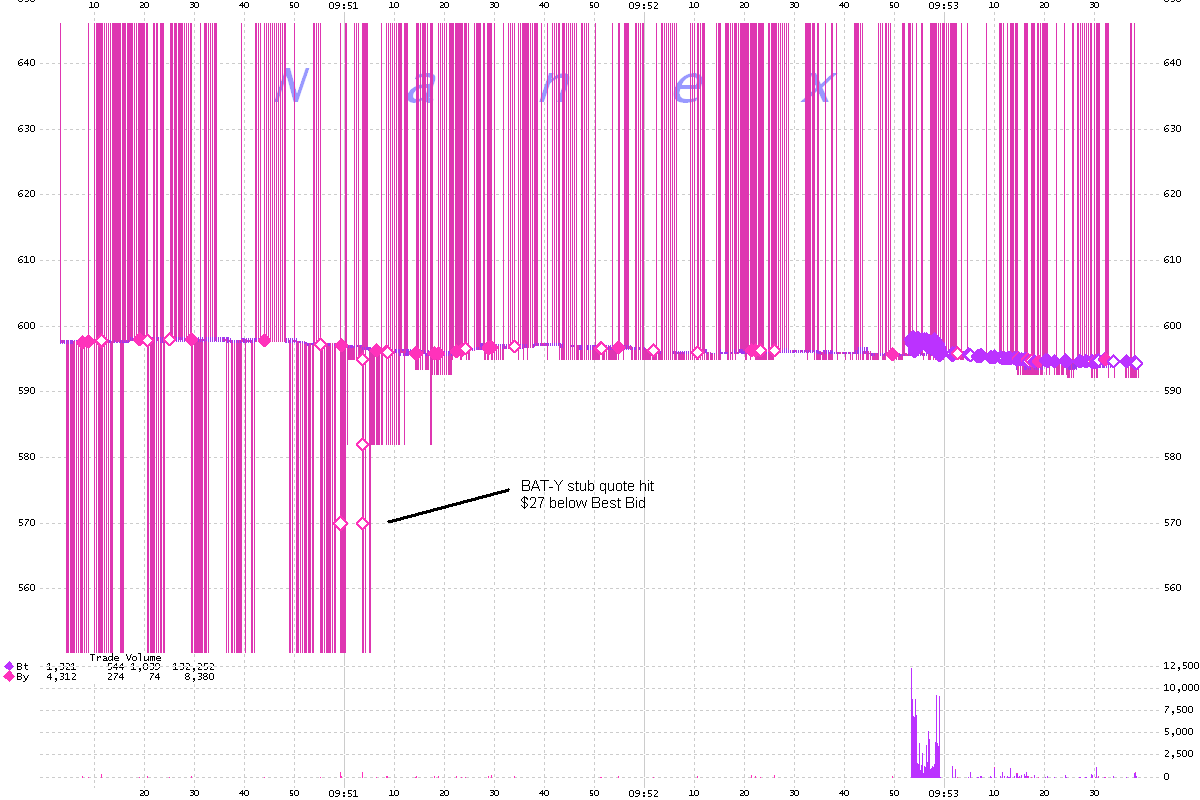
AAPL Stub Quote
A stub quote $27 below best bid executed in Bats-Y.
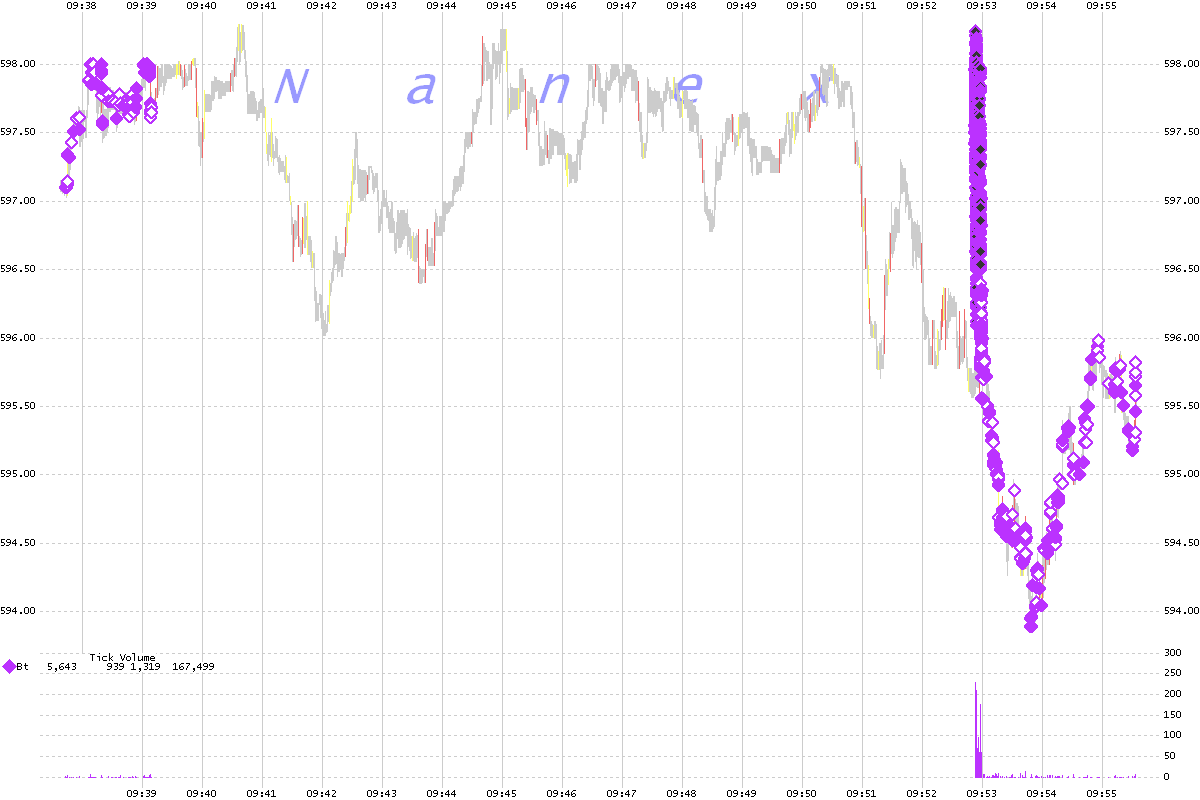
One second interval chart of AAPL showing BATS trades (pink) and NBBO (National Best
Bid/Offer) shaded gray for normal market, yellow for locked market (bid = ask) or
red for crossed market (bid > ask).
BATS Trade blast in QQQ
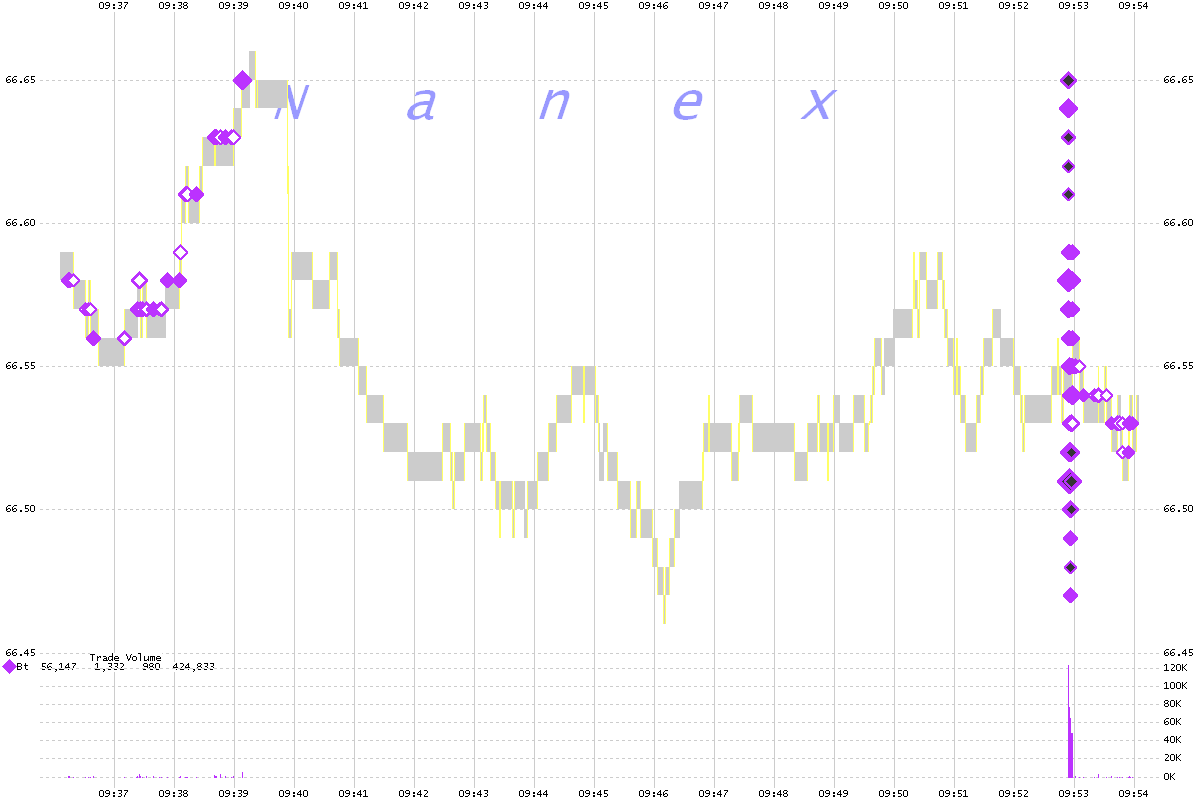
BATS Trade blast in GLD
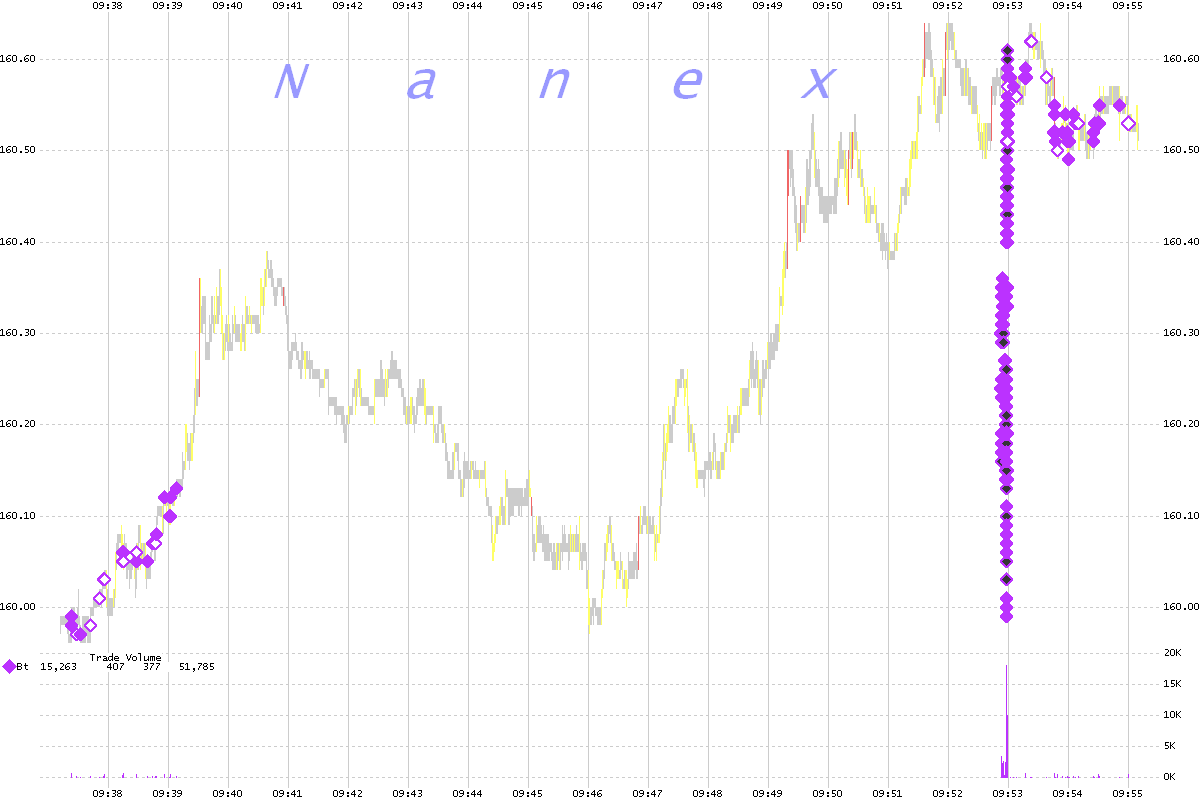
BATS Trade blast in NFLX
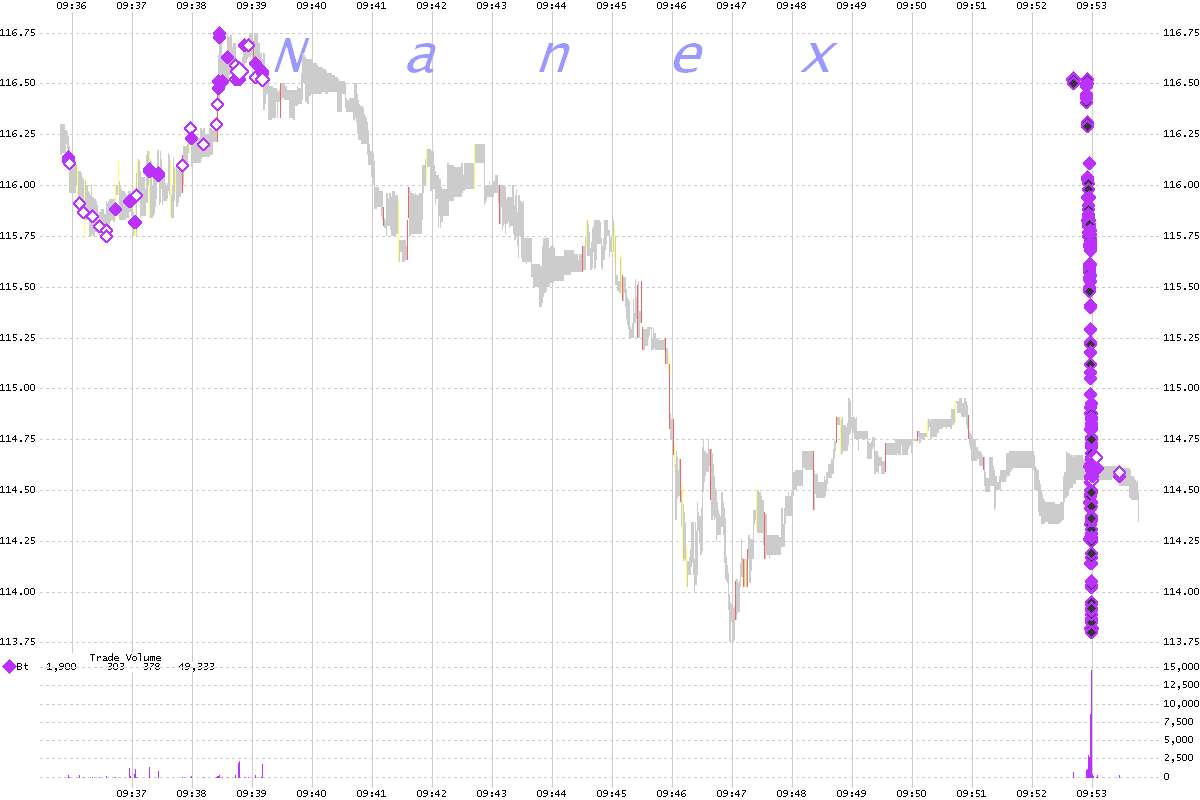
BATS Trade blast in SINA
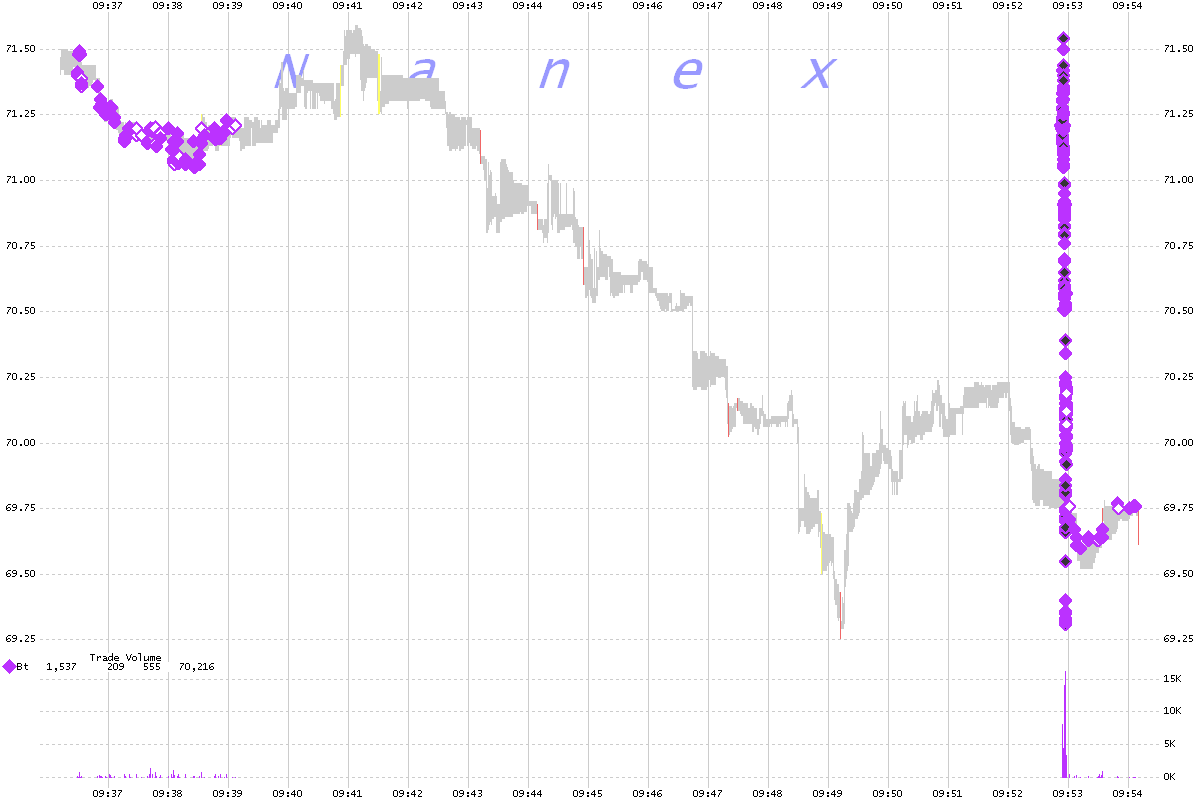
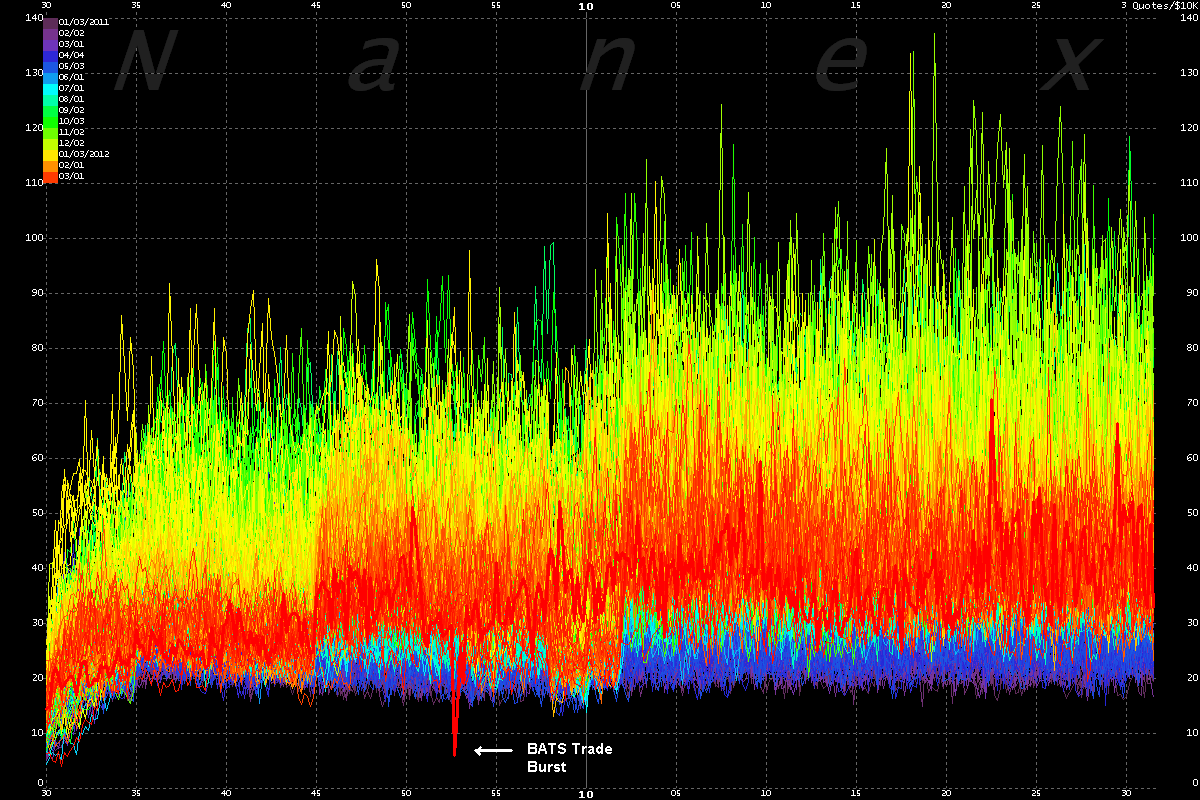
Quote/Trade ratio impacted by BATS Trade blast. Chart shows # quotes per 10K of stock traded
Nanex Research


