Nanex Research

March 20, 2012 ~ Another algo test running in symbol WRS
during active trading on NYSE and NY-ARCA
See also.
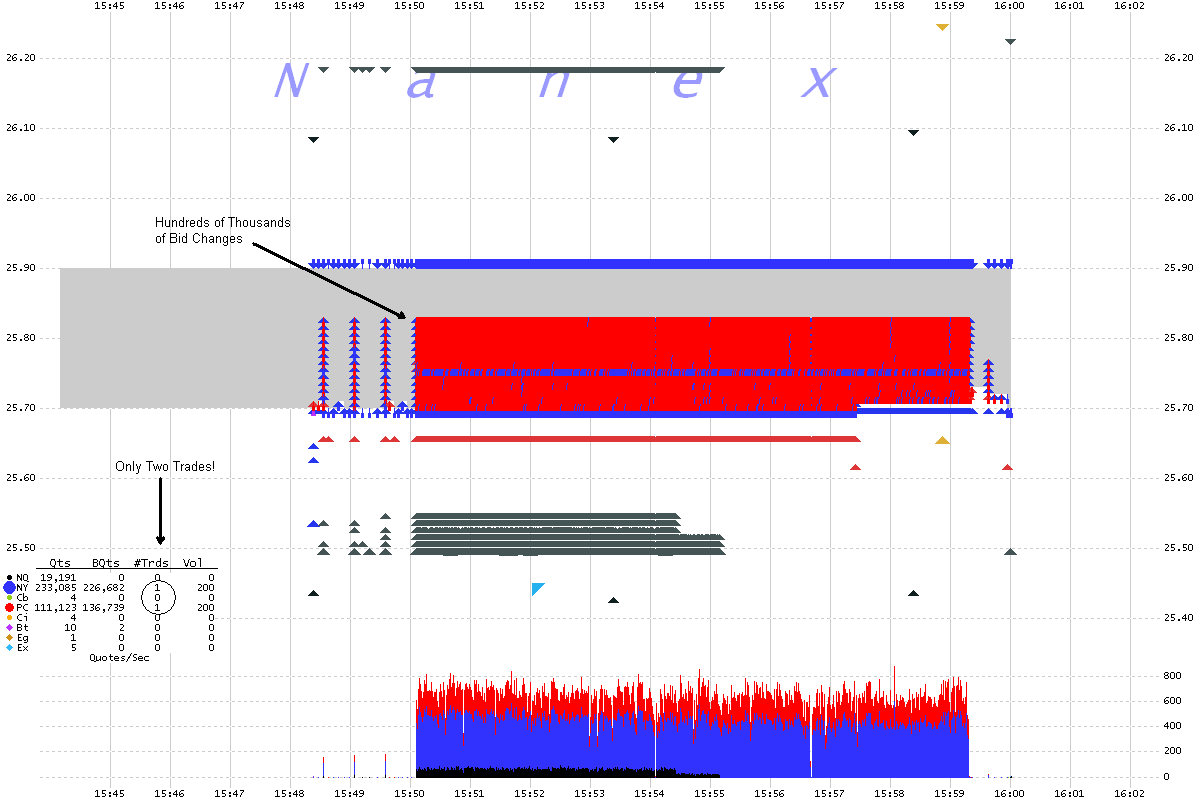
The 1 second interval chart of WRS below shows quotes (triangles), trades (circles -- which
are hidden by the mass of quotes) and NBBO spread (gray shading) in WRS. Over 350,000
quotes and just 2 trades (400 shares). Events like this are still common, yet should
have been banned months if not years ago.

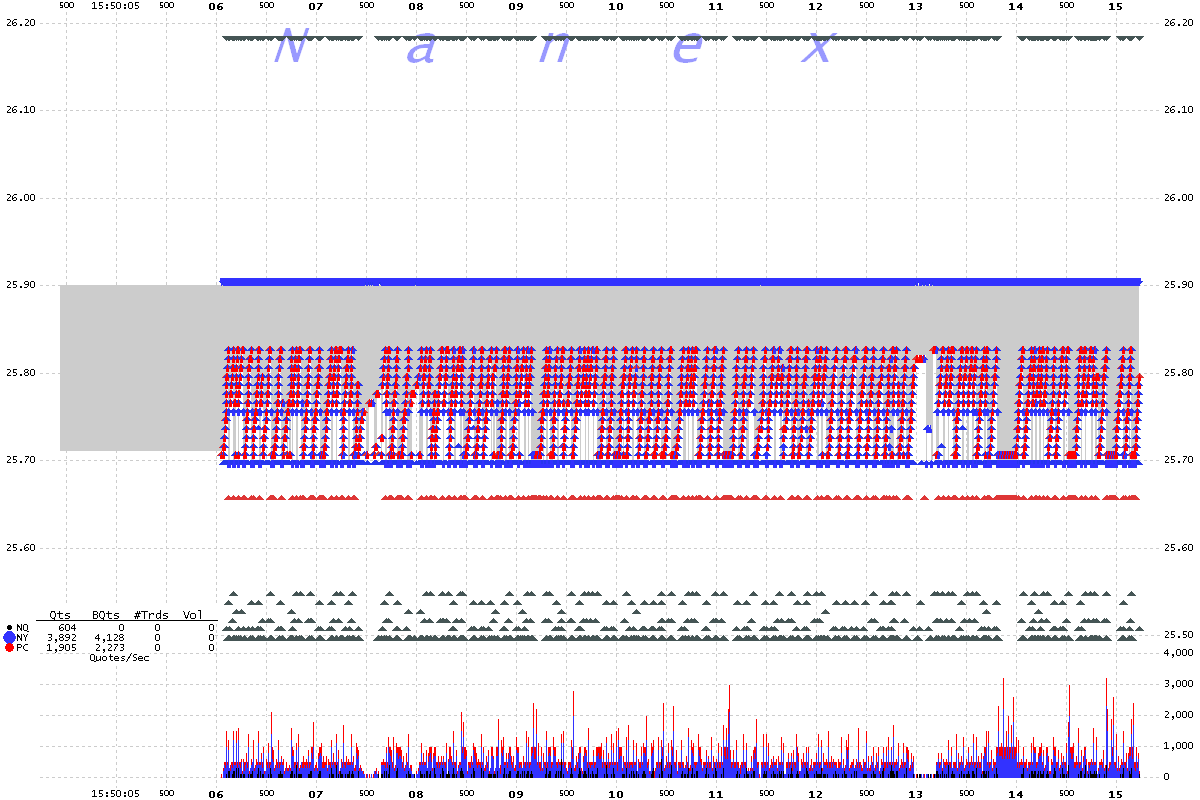
Zoom 1. WRS 10 millisecond interval chart. Nasdaq quotes (gray) remain outside the
best bid/offer. The best bid flutters wildly from NYSE (blue) to NY-Arca (red).

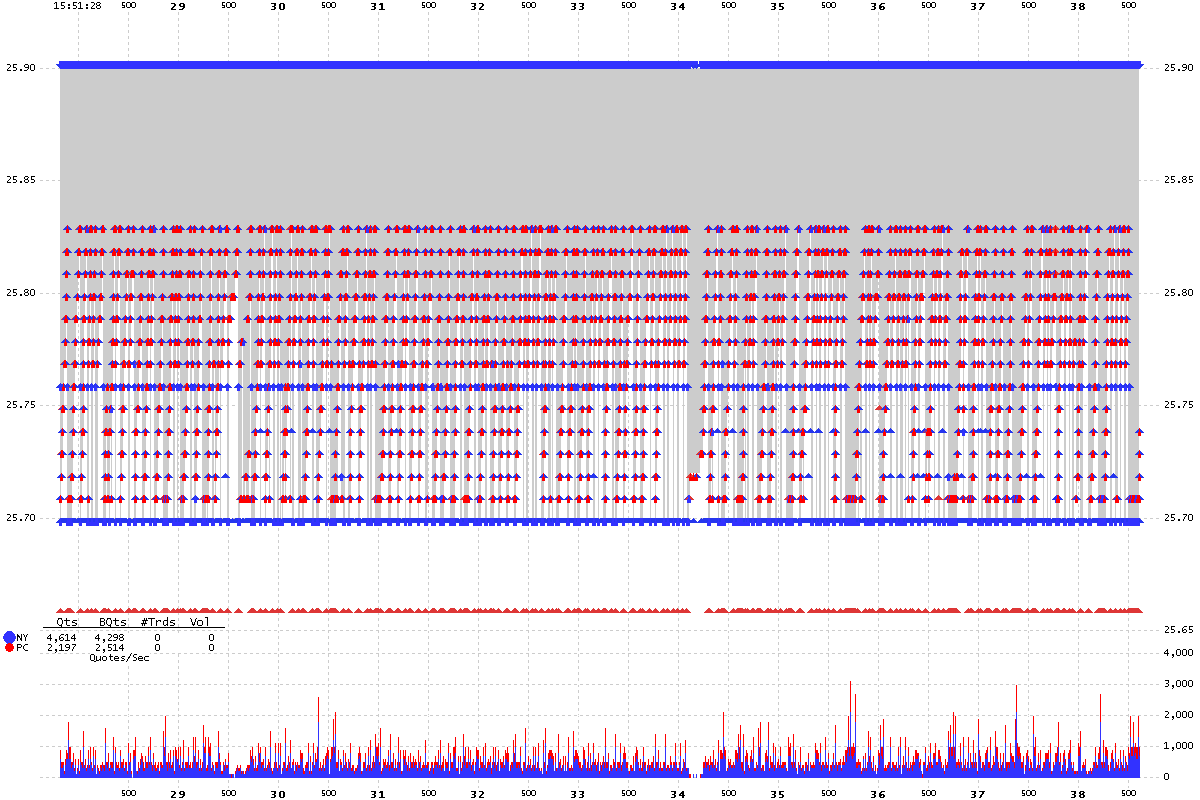
Zoom 2. WRS 10 millisecond interval chart. Note the rapid changes in the National
Best Bid -- cycling from 25.70 to 25.83 between NYSE (blue) and NY-Arca (red). Why
does this continue to happen?

Nanex Research


