Nanex Research

The RIO Event
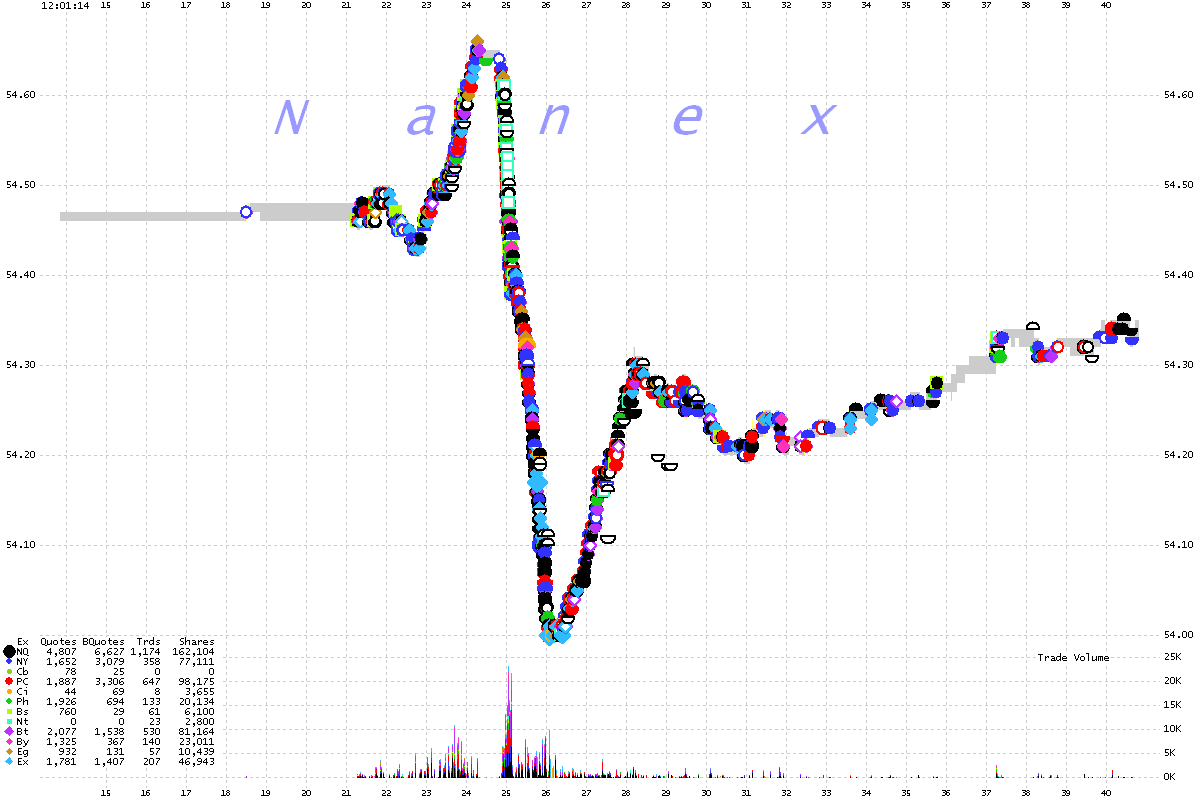
On March 21, 2012 at 12:01:23, the stock chart of RIO looked like the schematic for
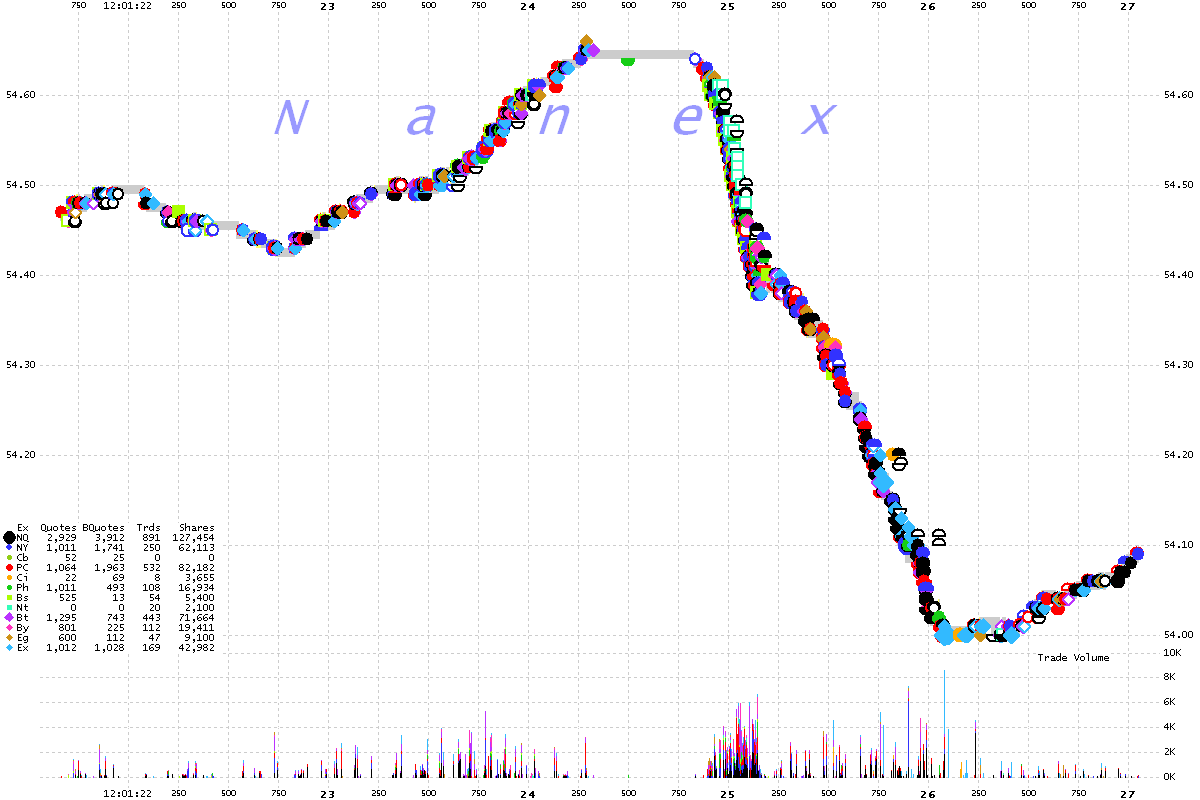
a rollercoaster. There is a 500 millisecond period of silence (no trades) right at
the top. The drop was over 1% and lasted about 1 second on significant volume.
25 millisecond interval chart showing trades colored by reporting exchange.

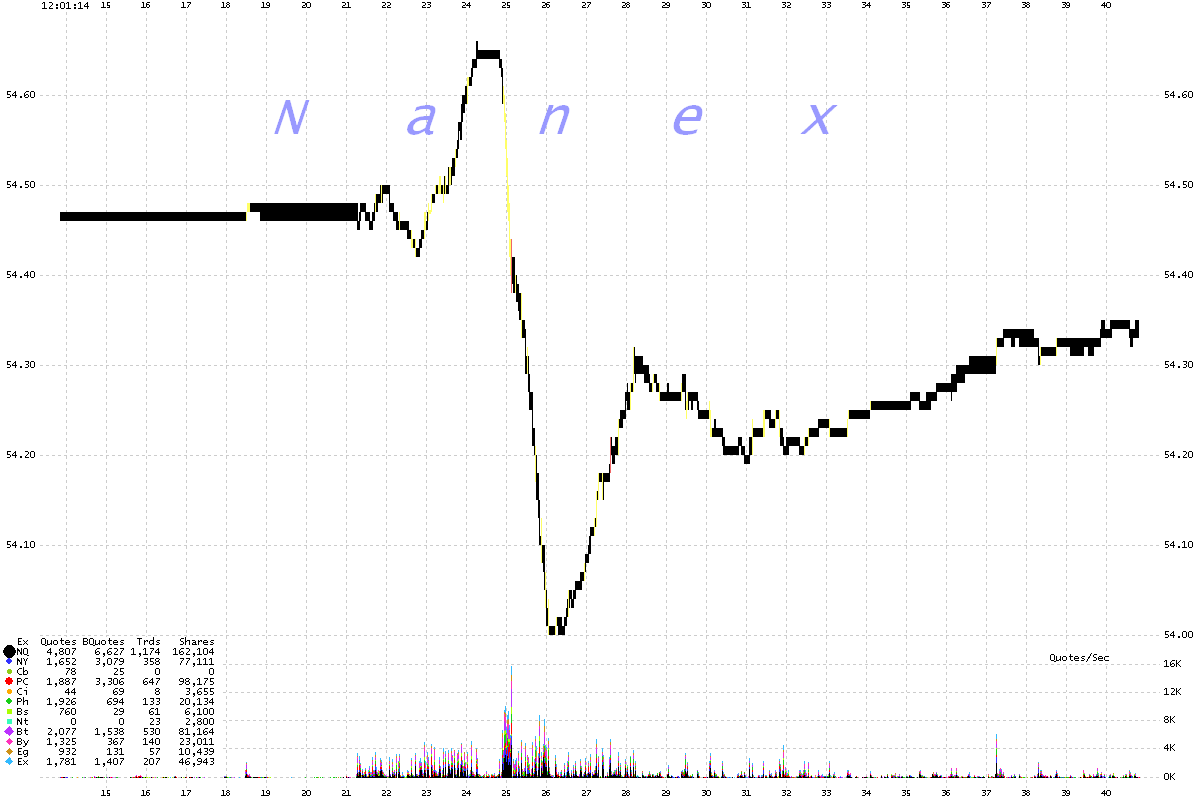
25 millisecond interval chart showing the NBBO
Shaded black if normal, yellow if locked
(bid = ask) or red if crossed (bid > ask).

5 millisecond interval chart showing trades colored by reporting exchange.
Note the eerie period of silence at the top.

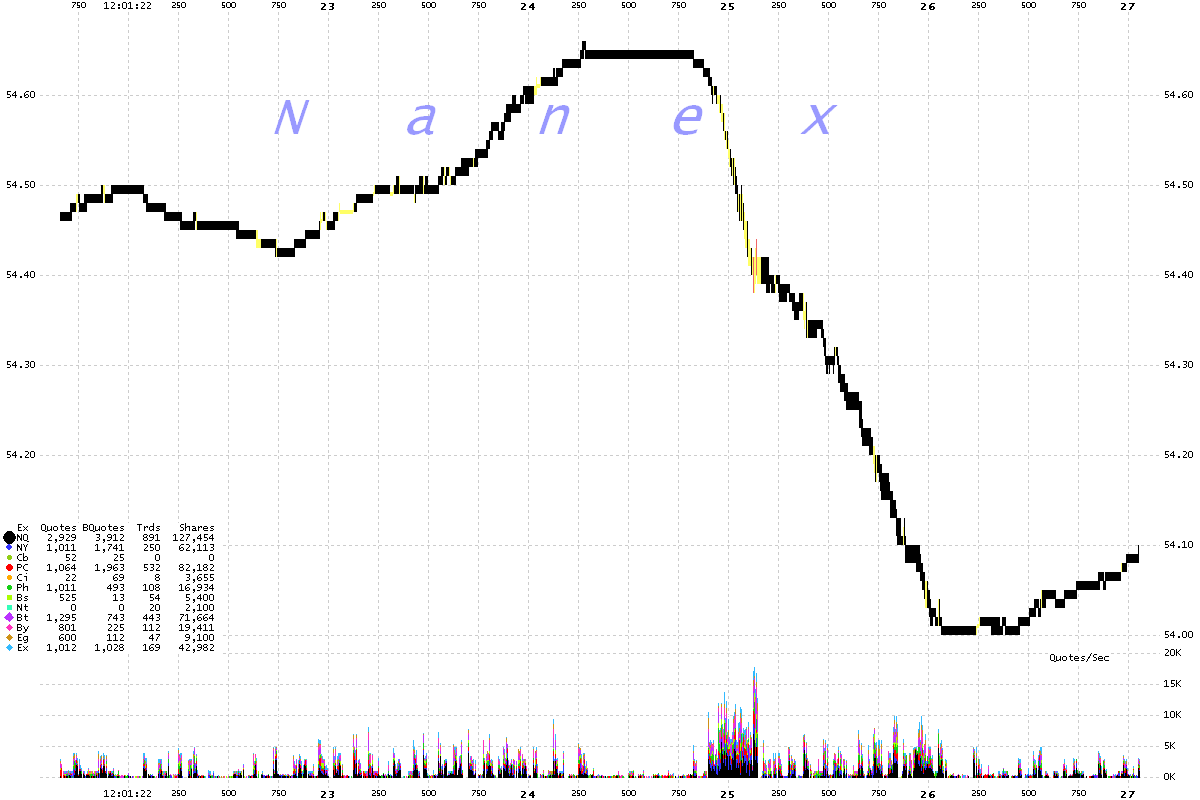
5 millisecond interval chart showing the NBBO.
Shaded black if normal, yellow if locked
(bid = ask) or red if crossed (bid > ask).

Nanex Research


