Nanex Research

The SPY Event on March 20, 2012
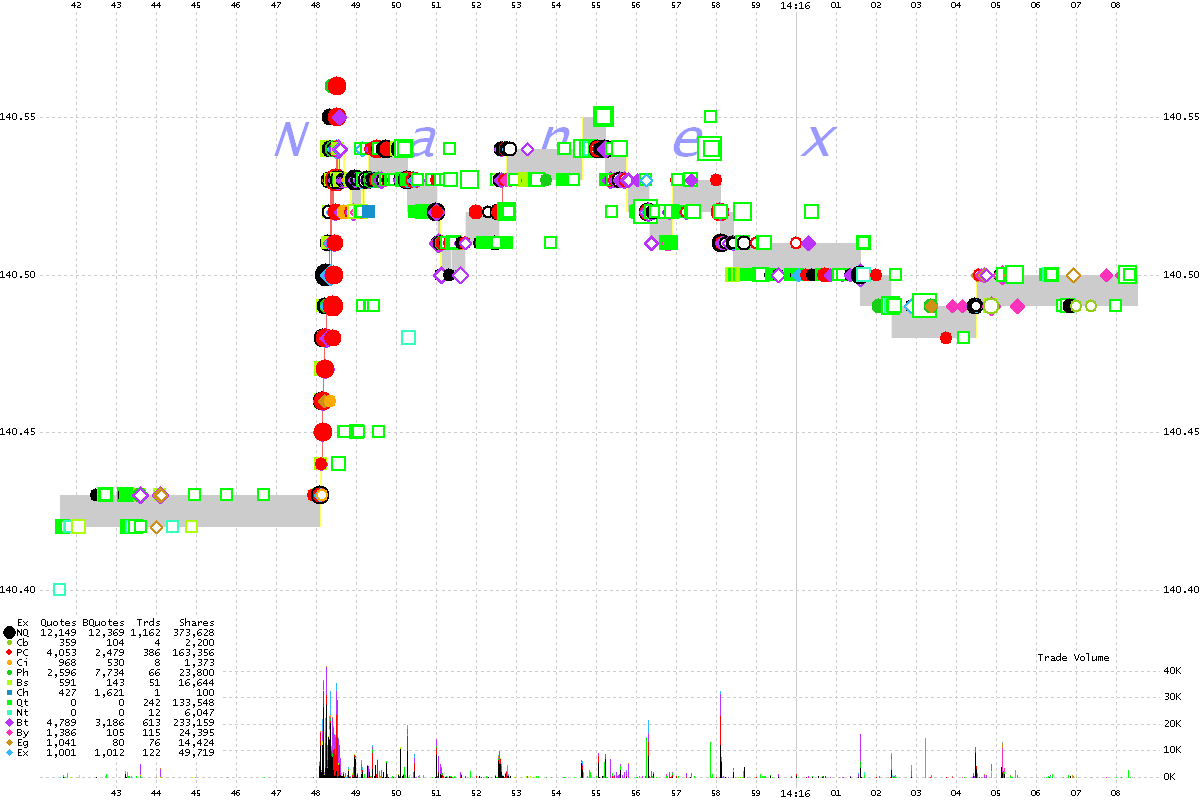
On March 20, 2012 at 14:15:48 there was an explosion of quotes and trades in many
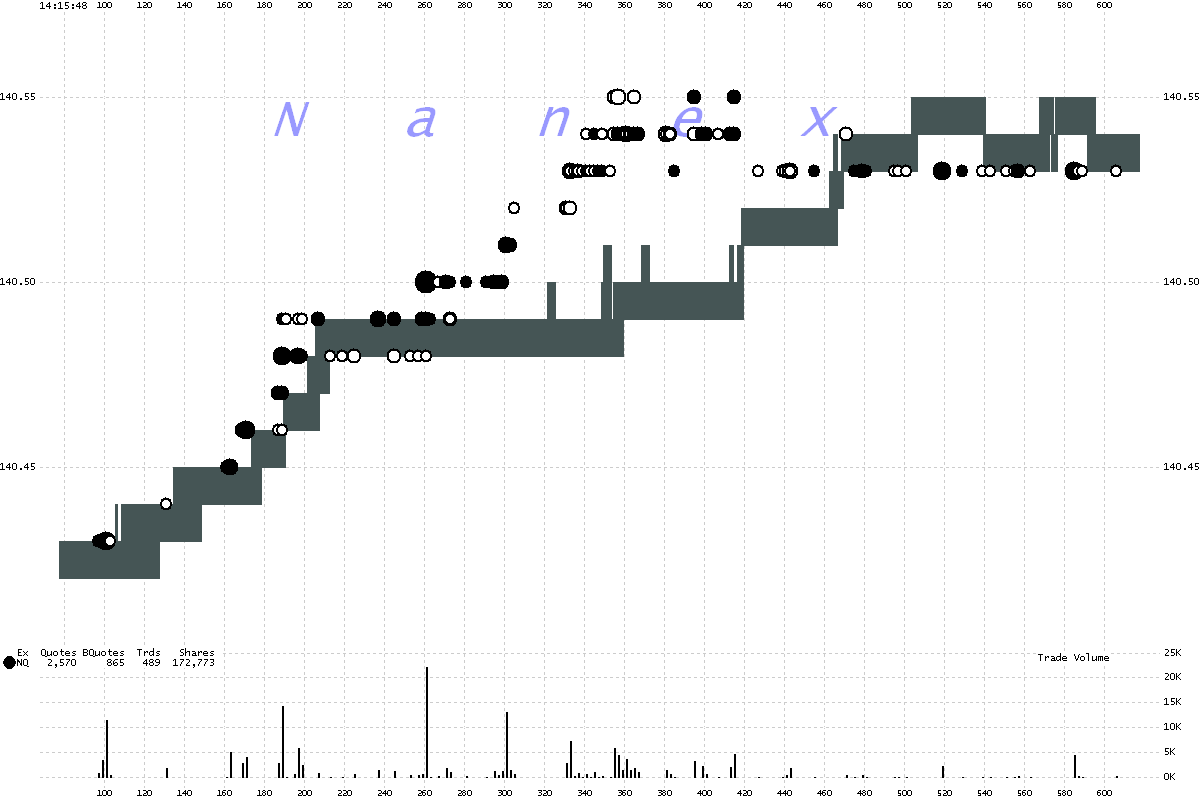
symbols. The charts below details SPY (an ETF). During this event, trades from Nasdaq
appeared up to 150 milliseconds ahead of their own quotes -- a condition
we have jokingly referred to as
fantaseconds.
Here is another page on this same event.
SPY 25 millisecond interval chart showing trades colored by reporting exchange.
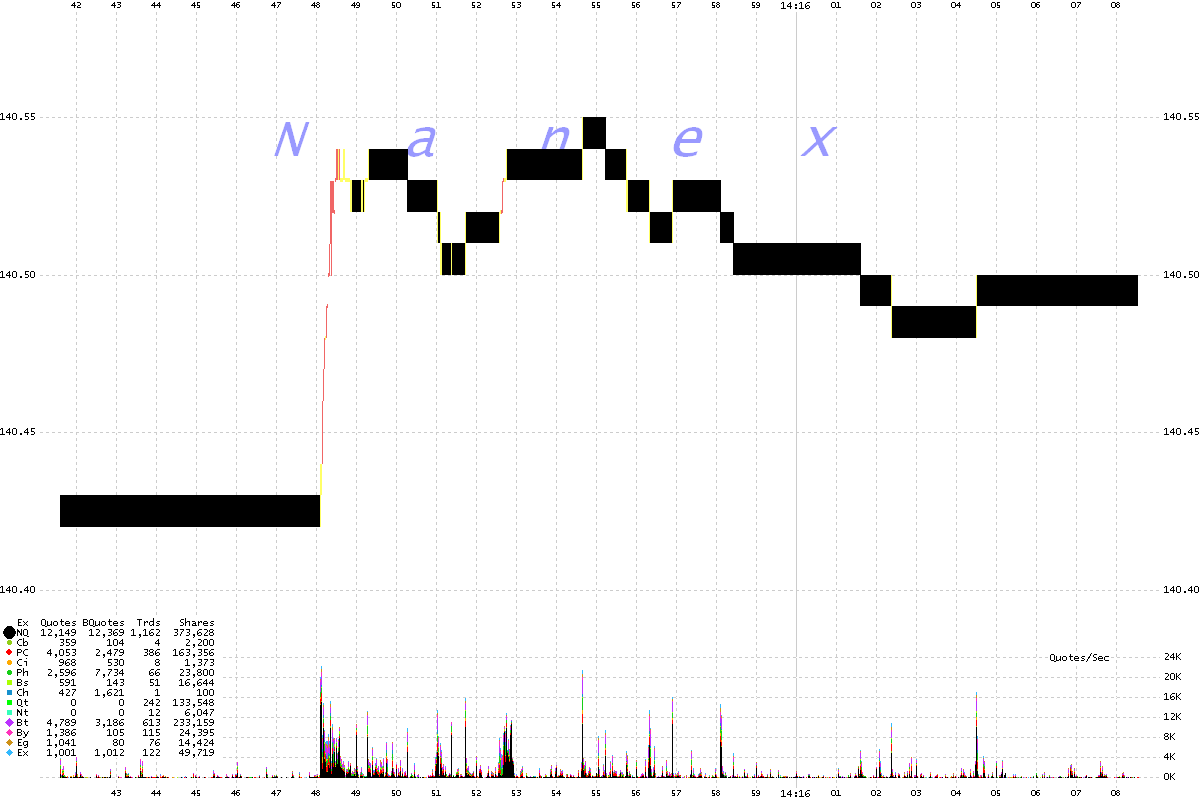
SPY 25 millisecond chart showing the NBBO
Shaded black if normal, yellow if locked
(bid = ask) or red if crossed (bid > ask).
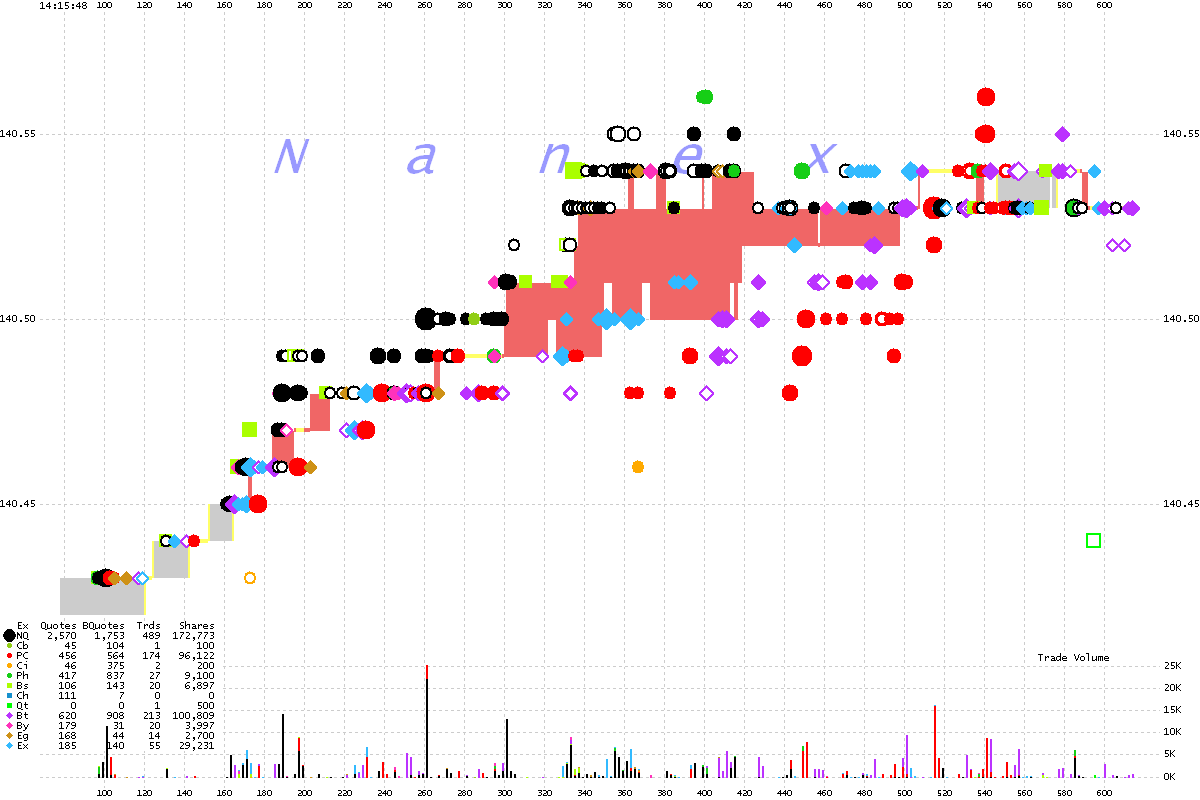
SPY 1 millisecond interval chart showing trades colored by reporting exchange
and NBBO.
Chart shows about 1/2 second of time.
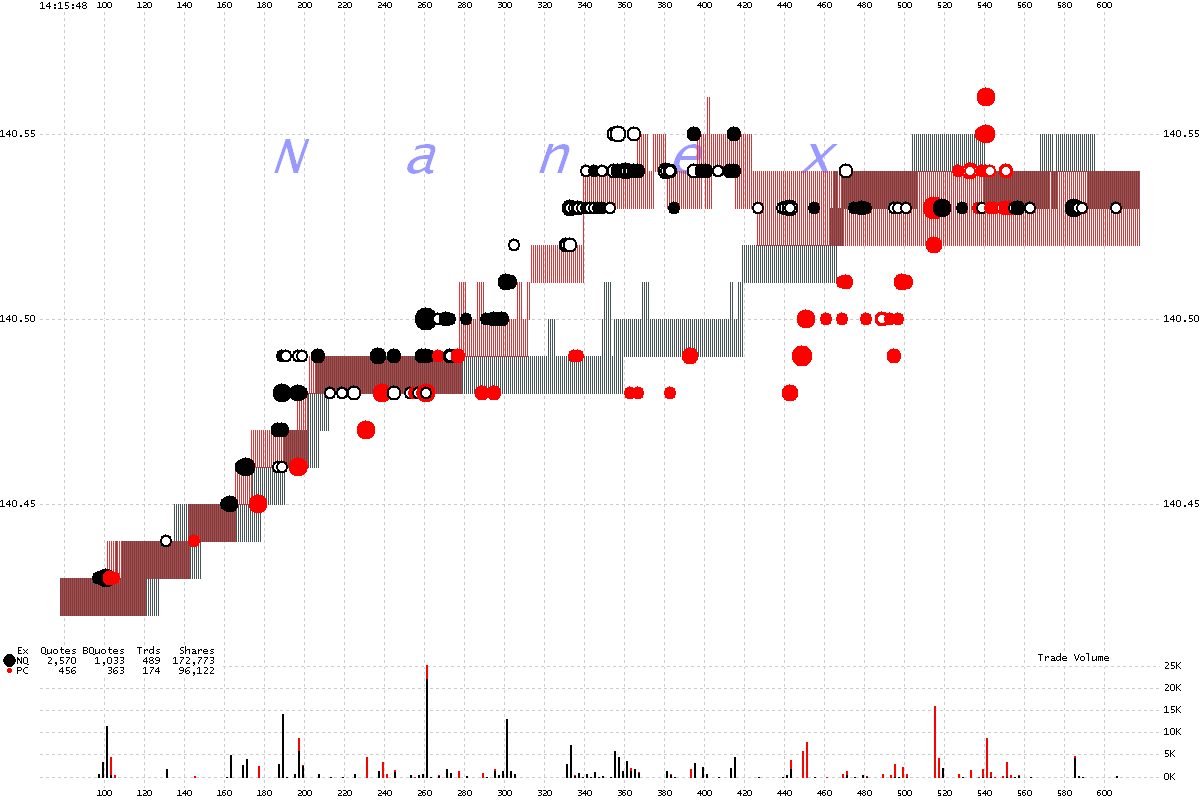
SPY 1 millisecond interval chart showing trades and quotes from Nasdaq (black)
and ARCA (red).
You can clearly see Nasdaq's quote (gray shading) is lagging ARCA's quote (red shading).
In fact Nasdaq trades are ahead of their own quotes. Arca's trades lag behind their
quotes (which is typical).
Chart shows about 1/2 second of time.
SPY 1 millisecond interval chart showing trades and quotes from Nasdaq.
Note how trades also appear ahead of quotes from the same exchange by nearly 150 milliseconds!
Chart shows about 1/2 second of time.
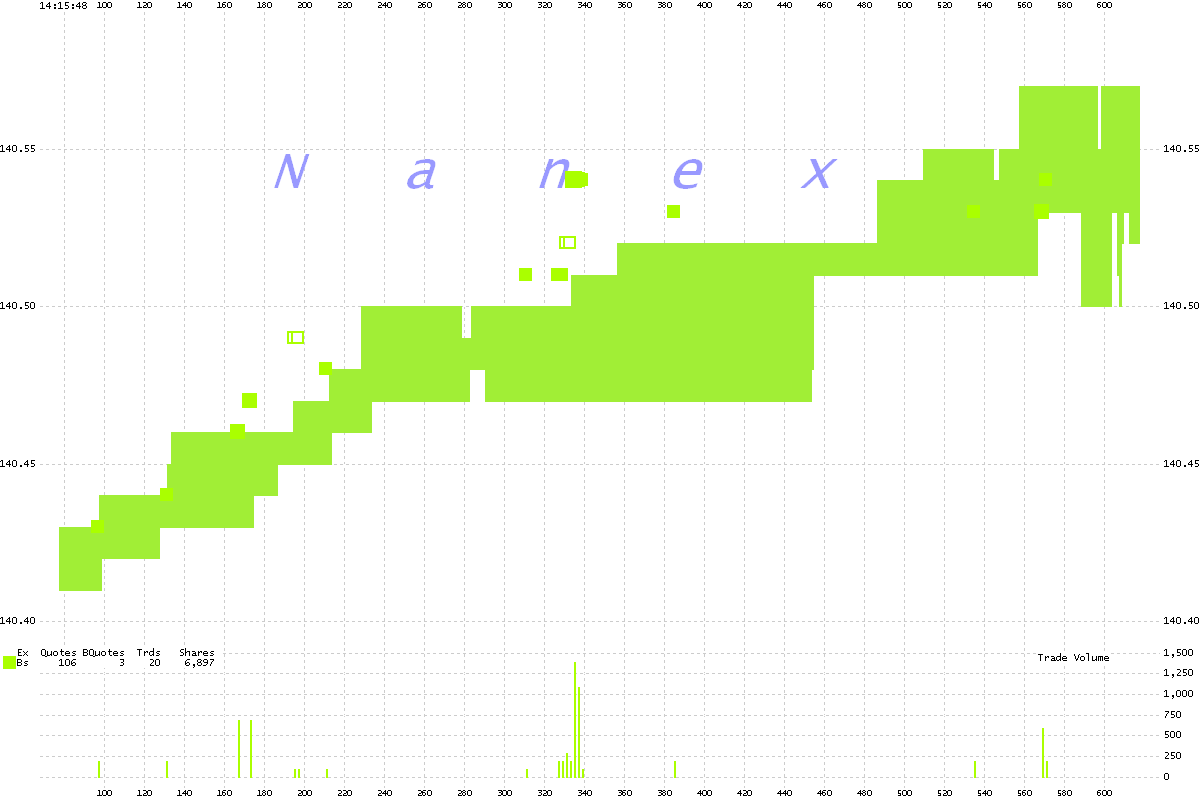
SPY 1 millisecond interval chart showing trades and quotes from Boston.
Note how trades also appear ahead of quotes from the same exchange. Chart
shows about 1/2 second of time.
Nanex Research


