Nanex Research

Nanex ~ The BATS IPO and halt in AAPL
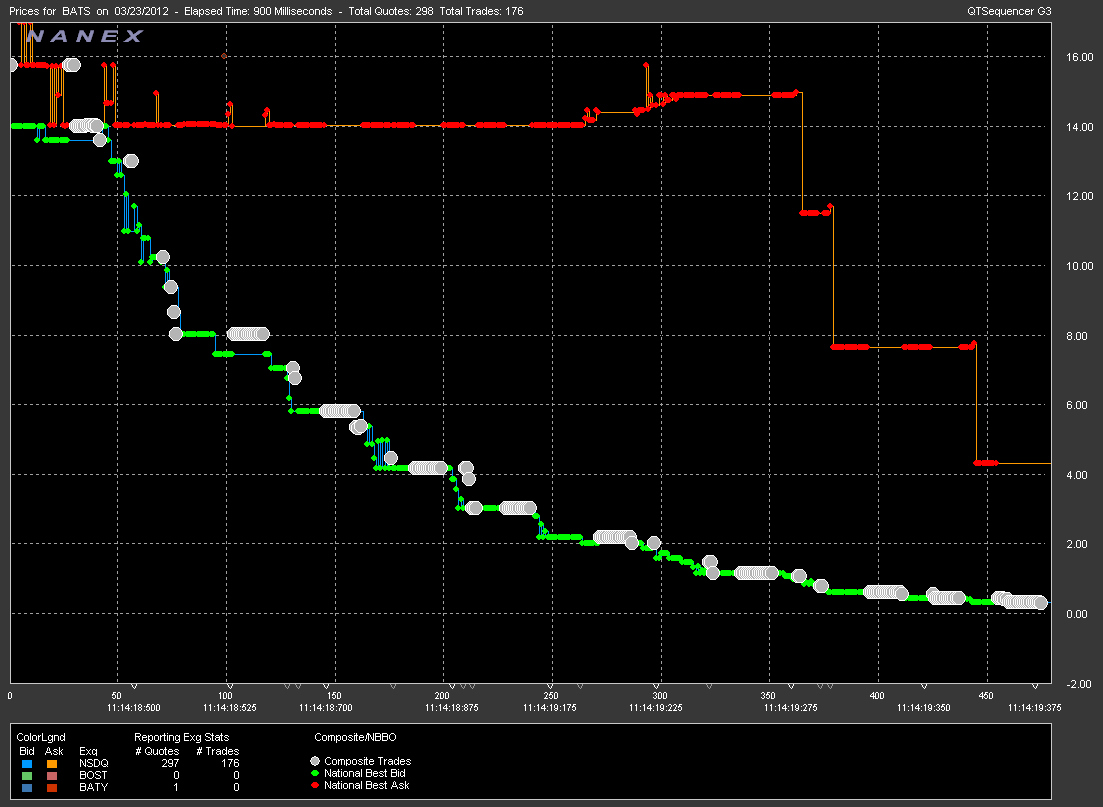
The March 23, 2012 IPO of BATS was brief. The stock began trading at 11:14:18.436
with an initial price of $15.25. Within 900 milliseconds from opening the stock price had fallen to $0.2848. Within 1.5 seconds the price bottomed at $0.0002.
567 trades were executed before the stock was halted (532 are shown below).
Another curiosity: we found that starting around 10:45 and ending around 11:20,
quotes from BATS stopped updating in all NYSE and Nasdaq symbols within a specific
alphabetical range: between "A" and "BECN". The symbol BATS falls into
this range. We have since
learned that BATS sent a notification
they were having problems with symbols A - BZZZ.
BATS had a problem with the same symbols again on April 4, 2012.
Update: April 30, 2013
We made a video of the BATS IPO.
Update: March 26, 2012
Below are 1 millisecond interval charts showing all trades in BATS after
the "opening trade report" from the BATS exchange. Other than the opening trade from
BATS, one trade was executed on BAT-Y at $0.0384 and the rest were executed on Nasdaq. Of these trades all those that match bid prices (and were therefore sales) were marked ISO. There were 24 trades from Nasdaq marked regular and each trade
price match recent ask prices and were in all likelihood buy orders.
Download a text file or
excel spreadsheet of all BATS trades and quotes
during this event. Take a look
at lines where the bid size flutters from 1,500 shares (from the spreadsheet, look
at records starting with these numbers #243, #358, #432, #554, etc ). Note how the
sell algo waits a period of time rather than execute blindly against all bids.
ISO stands for
Intermarket Sweep Order and this condition is used when a trader wants
to sweep the top of the book (in this case, all the bids) at all exchanges. It prevents
the order from being routed to another exchange even if that exchange has better prices
-- because the trader has already sent orders simultaneously to the other exchanges
and a routing loop could develop otherwise. The problem in this case, is that there
were no other exchanges with bids to sweep! There was no bid with size coming from
BATS or any other exchange according to
CQS -- which is the official feed for identifying
the
best bid or offer from all exchanges. So the use of an ISO order is this case is suspect. We have seen ISO orders abused like
this before,
such as the seemingly intentional halt in
CSCO back on July 29, 2010 when AMEX first started trading Nasdaq listed stocks.
The other interesting thing to note in these charts is how some bids with better prices
are skipped over and not executed on the way down, further evidence that this was
not a fat finger mistake, or inadvertently placed market order.
Charts show trades (circles) are quotes
(triangles) executed on Nasdaq
While the first print (trade) at a price of $15.25 and size of 1,199,652, was executed on the BATS exchange, the
trade was an Opening-Report and is not included in the charts below.
All other trades were executed on the NASDAQ exchange.
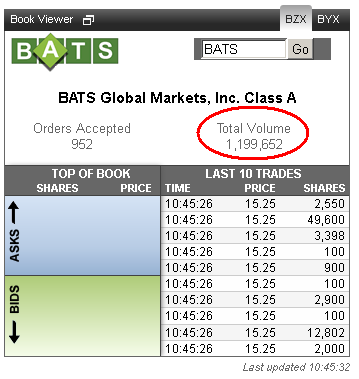
The BATS website shows the first trade prints at 10:45:26,
yet the Opening Report in the official CTA feed has a time stamp of 11:14:18! The
size shown on the BATS website (Total Volume circled in red) matches the size of the
opening report from CTA. We wonder if something failed at BATS at precisely the opening
in BATS (this is also when quotes from BATS stopped in many symbols). We also wonder
how the exchange timestamp could be almost 30 minutes later than when the trades actually
executed. Since the 952 trades shown on BATS website was reported as one "Opening
Report" trade on CTA, it would make sense that this was manually entered as one trade
instead of 952 (you know, to save typing).

The majority of the fall happened in just 900 milliseconds:
Plotting both price and size:
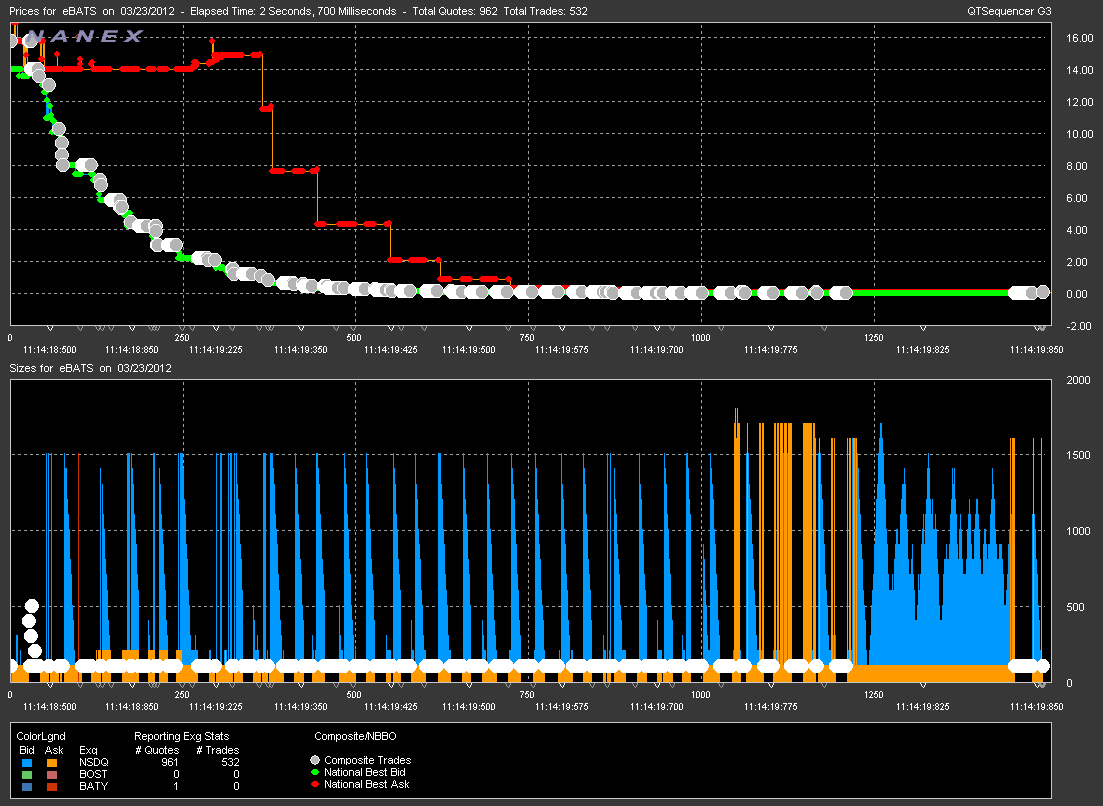
Plotting the 500 or so BATS IPO trades shows that prices declined logarithmically.

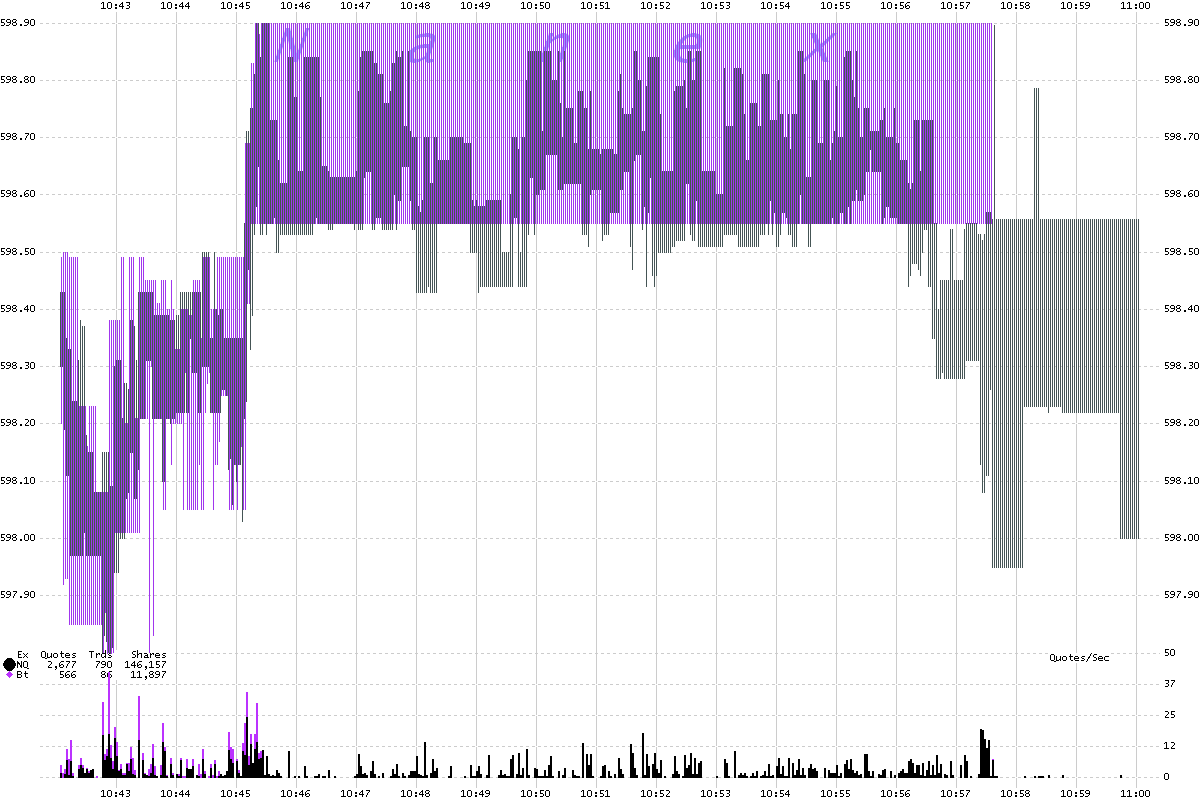
Approximately 15 minutes before the halt in BATS, trading in AAPL was halted due to stub quoting on the BATS-Y exchange.
Just three days earlier, a trade in AAPL $20 below the market executed on BATS-Y!
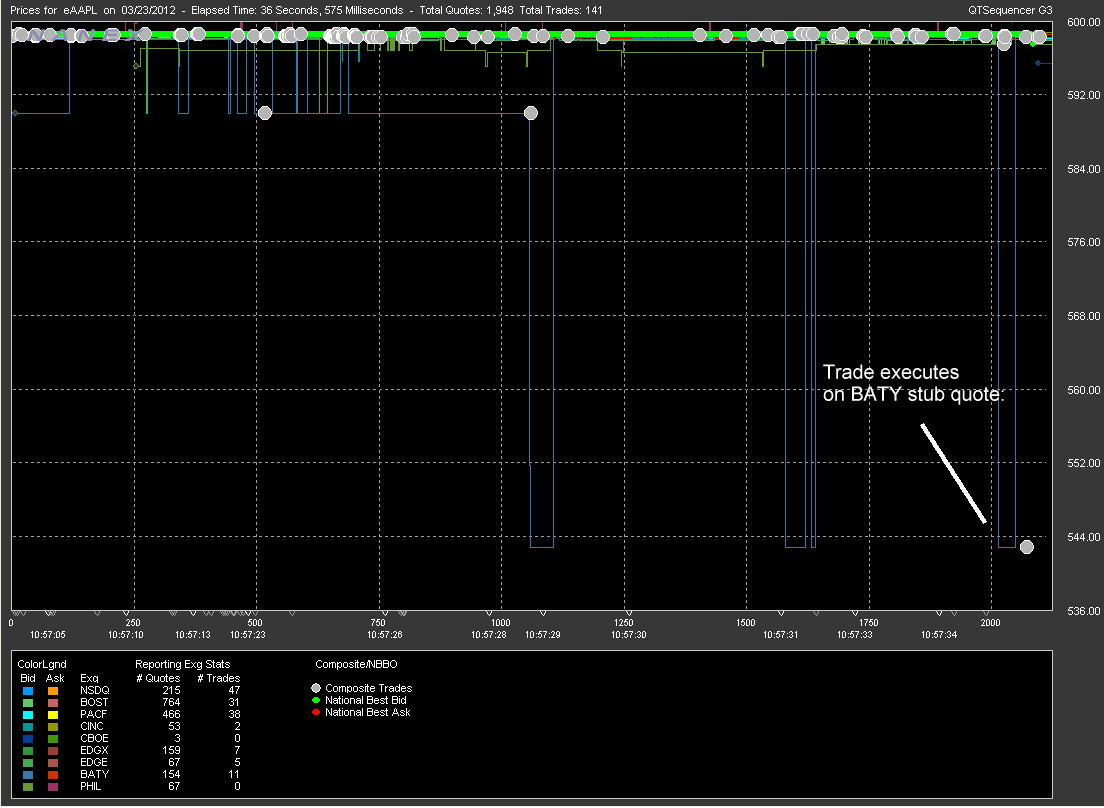
The 2 second interval chart of AAPL below shows how BAT's stuck quote (pink) causes
a crossed market with quotes from Nasdaq (gray). Within a second of BATS withdrawing
their quote (end of the purple shading at 10:57:37, a trade executes at a stub quote
$54 below the market at BATS-Y (the other BATS exchange) and halts AAPL for 5 minutes.
This very same thing happened in AAPL three days earlier!
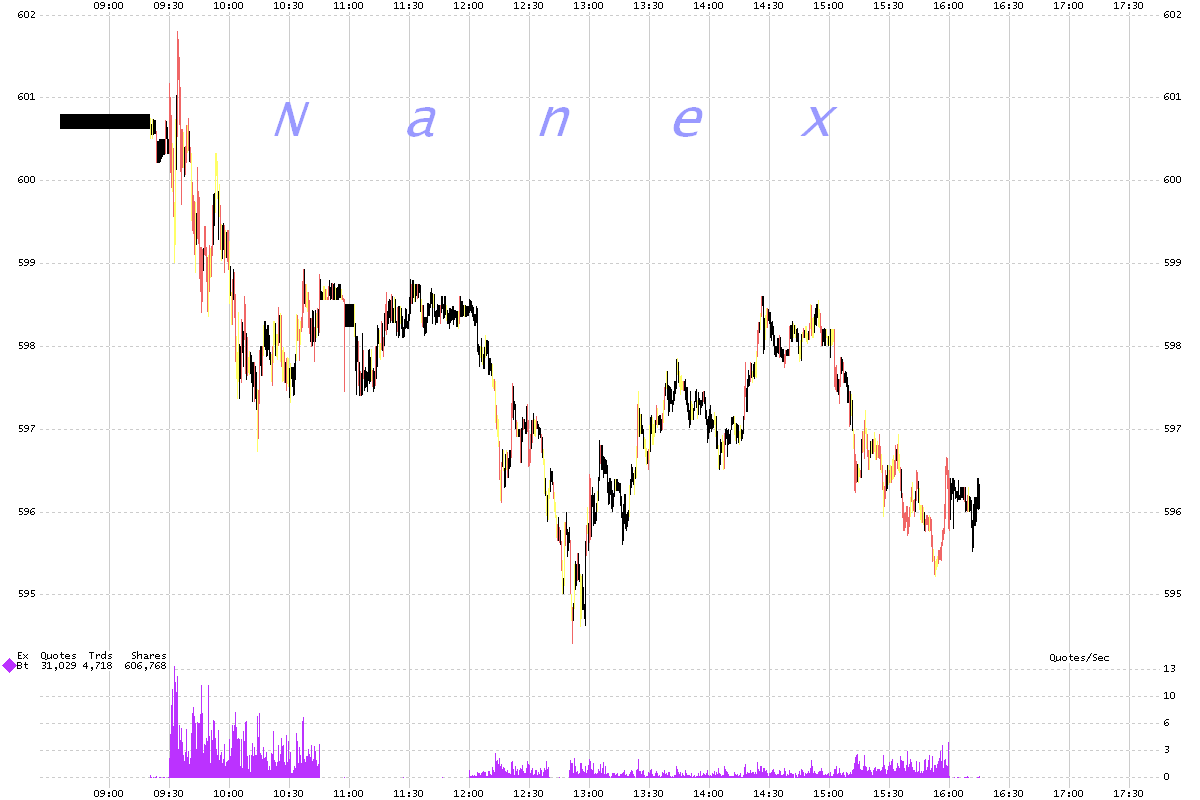
AAPL 30 second interval chart showing the NBBO and quote rate for BATS. NBBO is shaded
black for normal market, yellow for locked market (bid = ask) or red for crossed market
(bid > ask). Note there's a second outage from about 12:40 to 12:50. Also note
how the market is locked and crossed less when BATS isn't quoting.
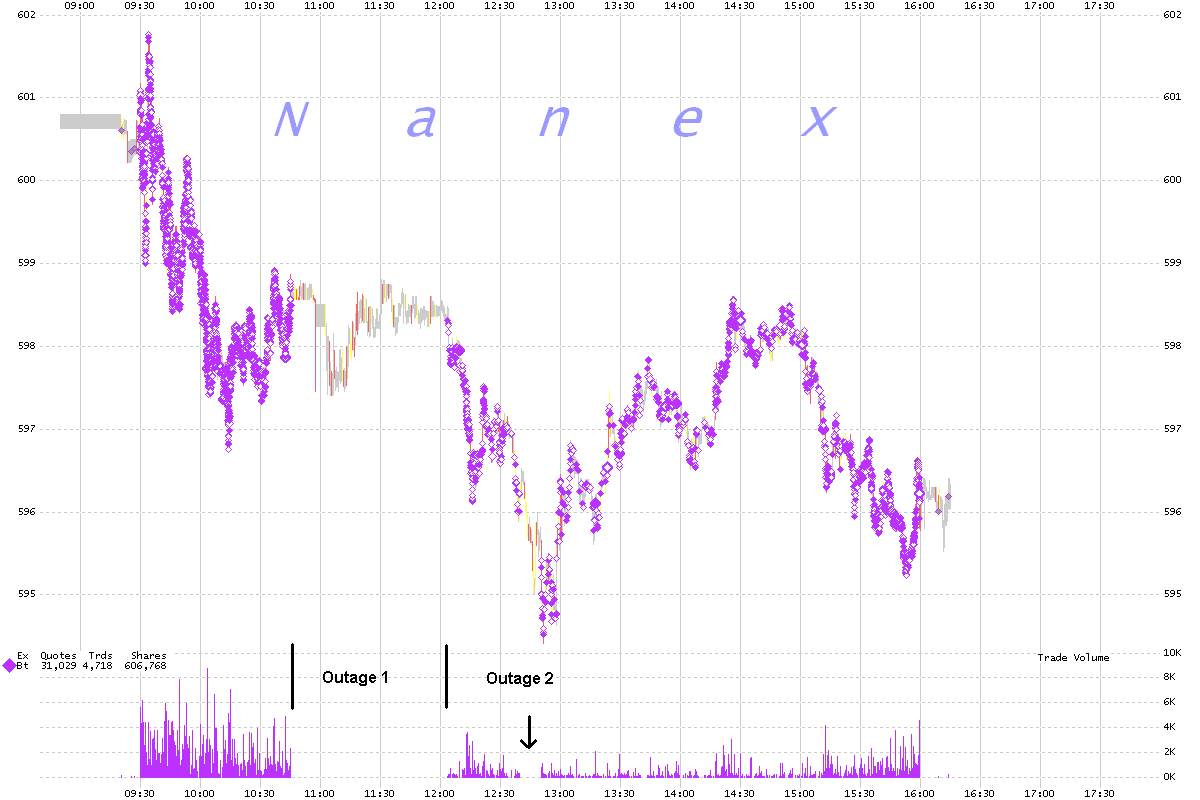
AAPL 30 second interval chart showing the NBBO and trades (pink dots) executing at
BATS.
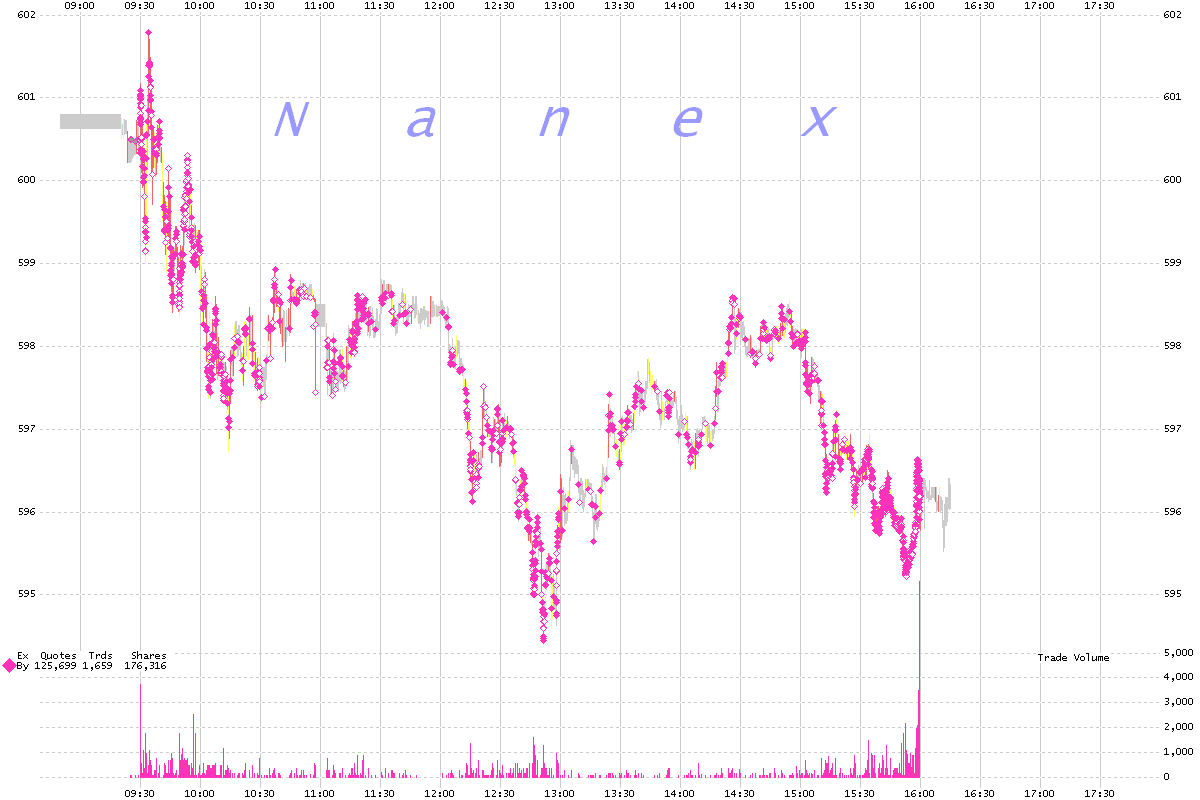
AAPL 30 second interval chart showing the NBBO and trades (pink dots) executing at
BAT-Y..
Update: March 27, 2012
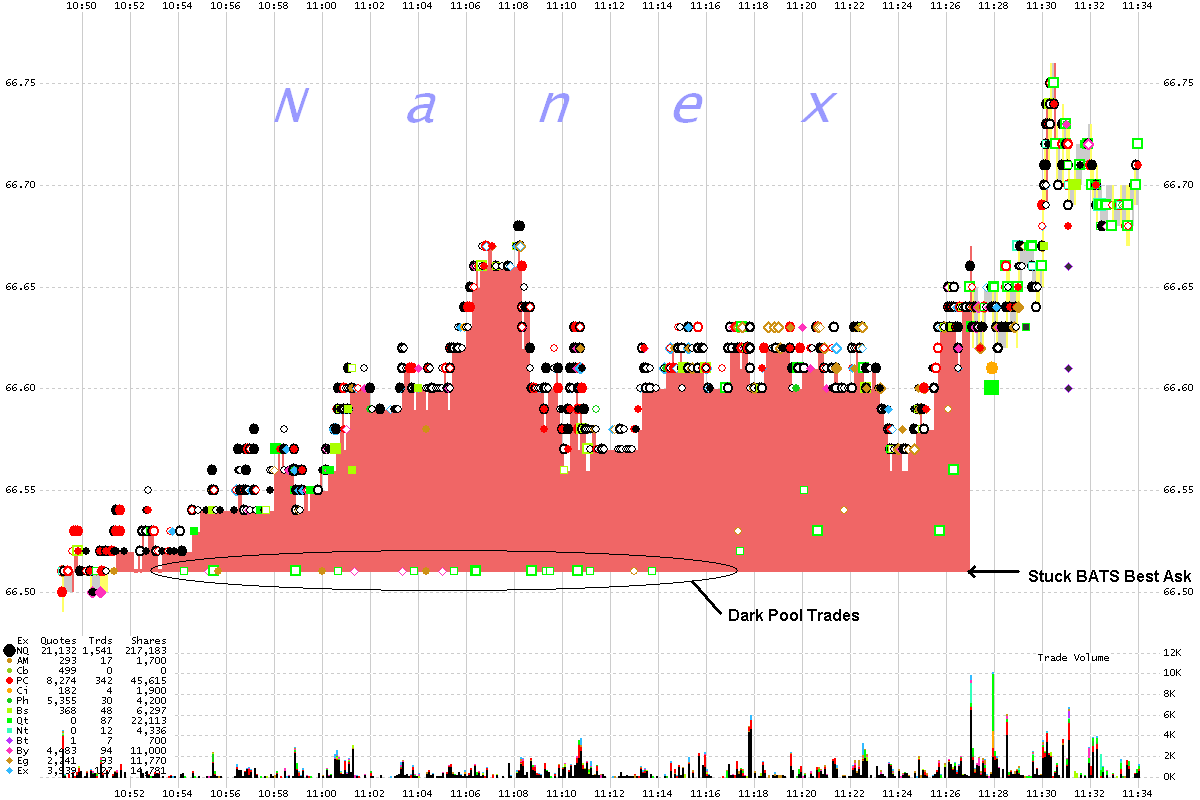
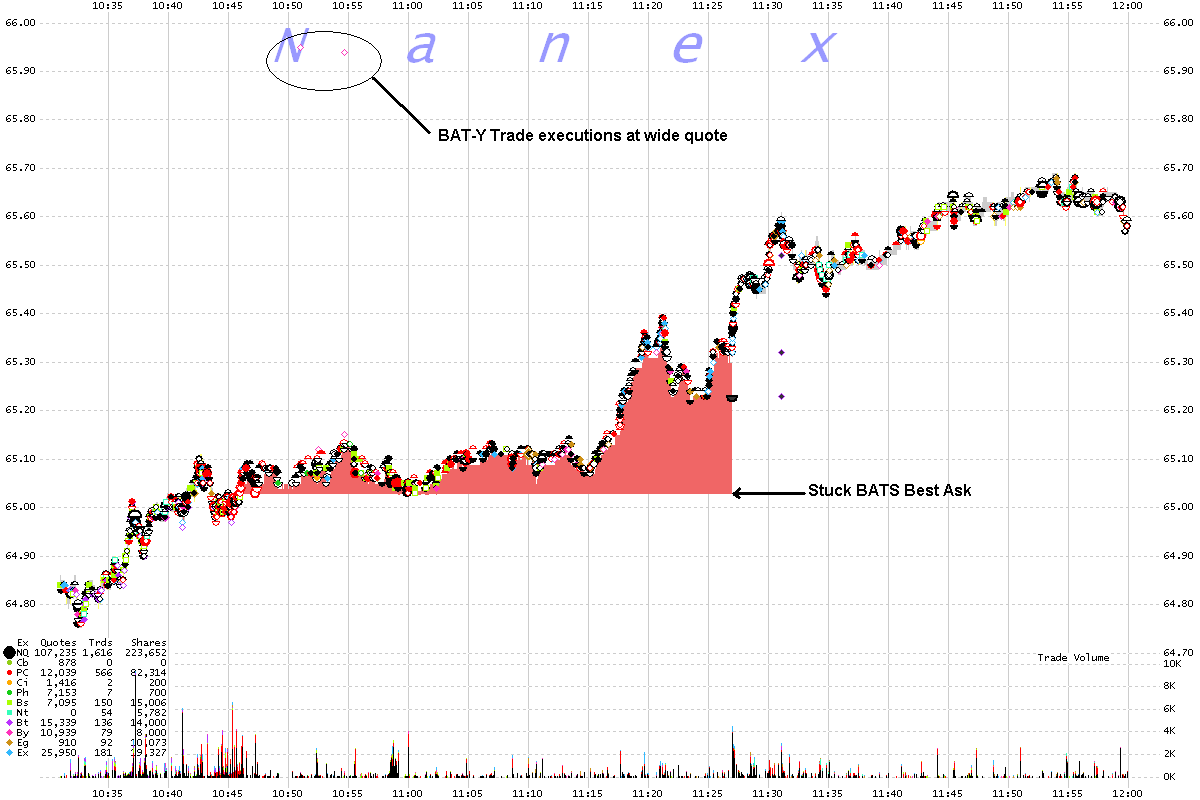
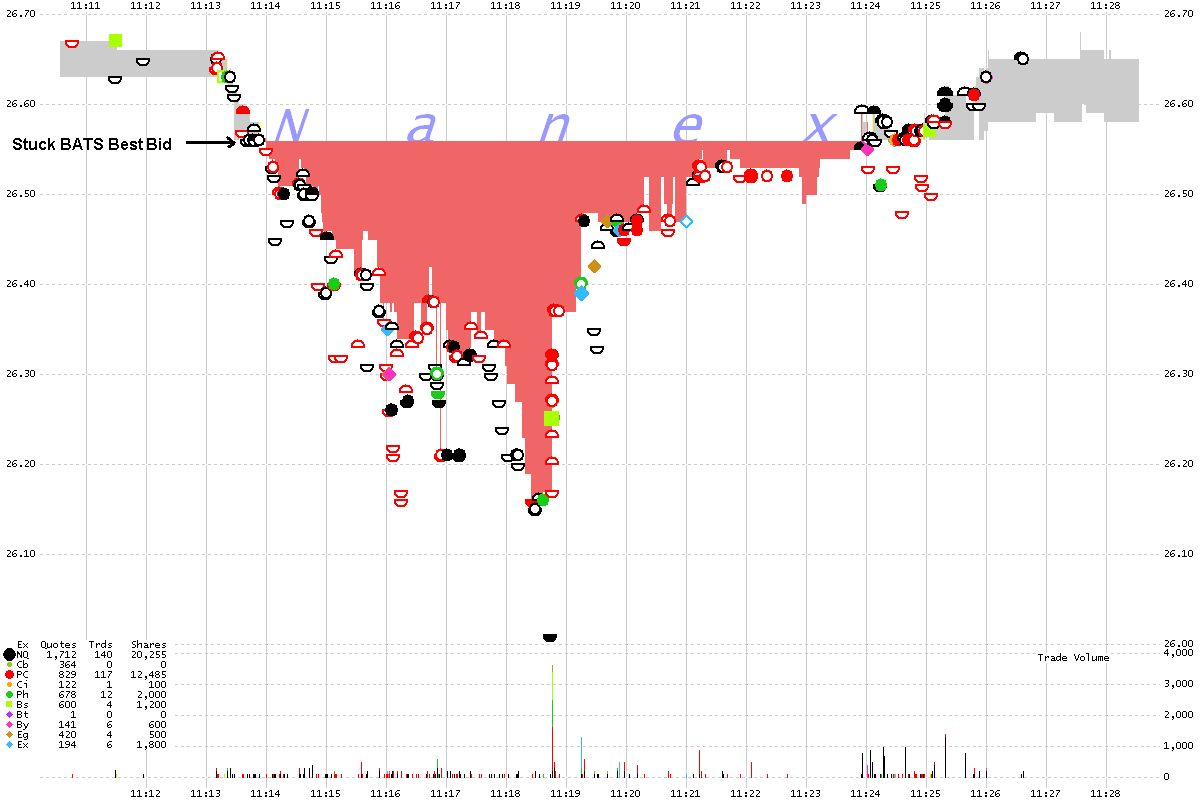
We found 3 more stocks that were affected by the BATS outage. None of the
trades executed at inferior prices were canceled.
AMGN 5 second interval chart showing the NBBO and trades from all exchanges.
The red shading shows the magnitude of the NBBO crossed quote (due to the stale BATS
quote). Note the dark pool trades that execute at this stale BATS quote.
BBBY 5 second interval chart showing the NBBO and trades from all exchanges.
Note the wide executions in BATS-Y (circled)
ACOR 1 second interval chart showing the NBBO and trades from all exchanges.
It might be coincidence, but ACOR quickly dropped and then recovered at the same time
a stale quote from BATS caused the NBBO to cross severely (red shading).
Nanex Research


