Nanex Research

Nanex ~ The Speed of the Market
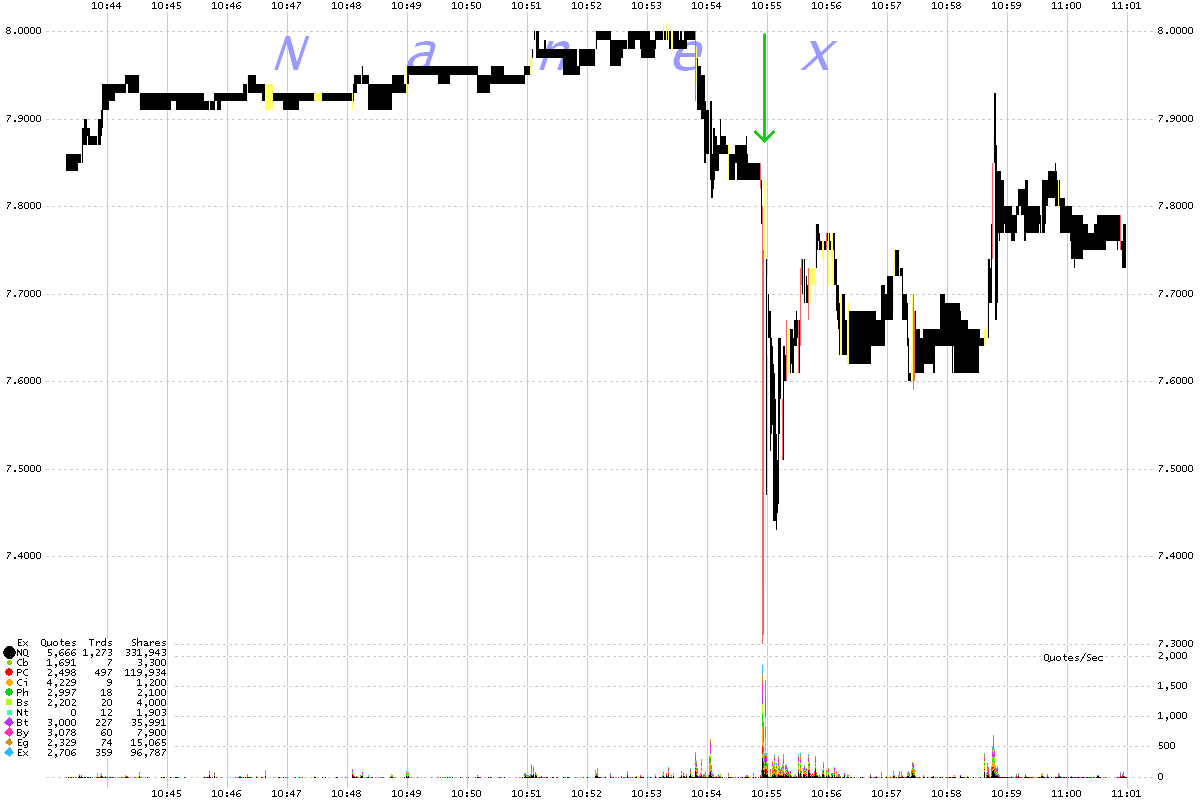
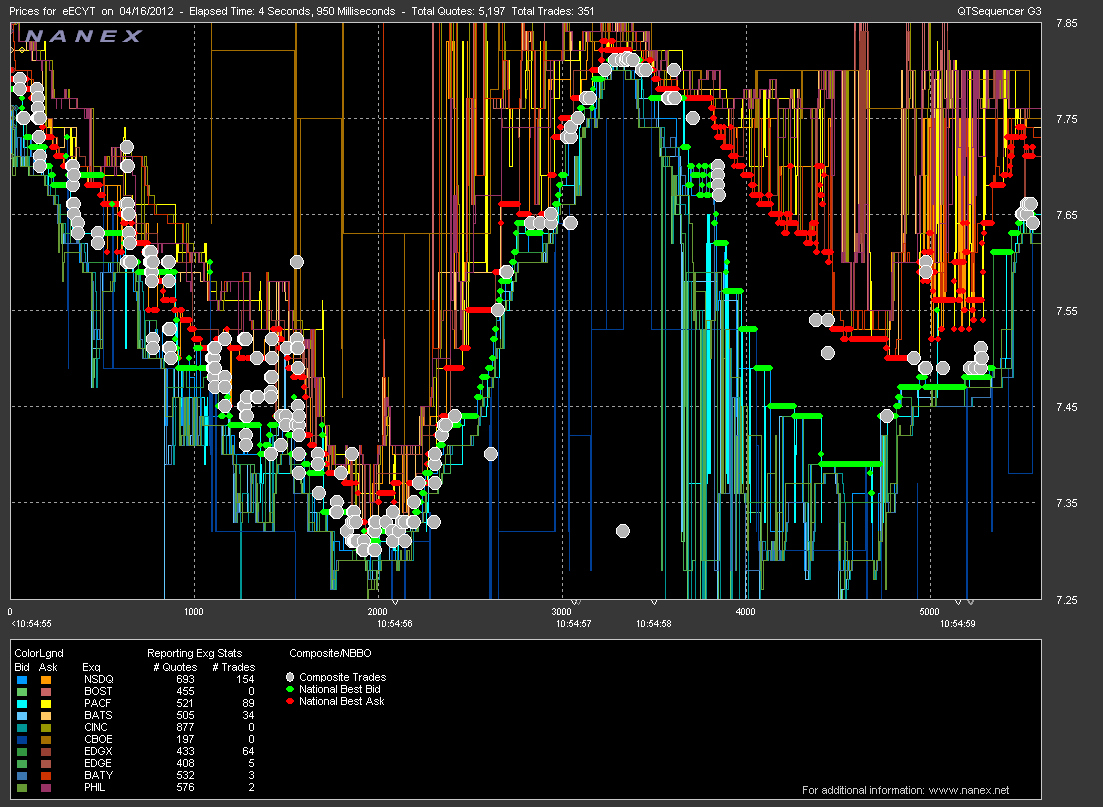
On Monday, April 16, trading in stock symbol ECYT dropped 6.6% in 1 second, then fully recovered the very next second.
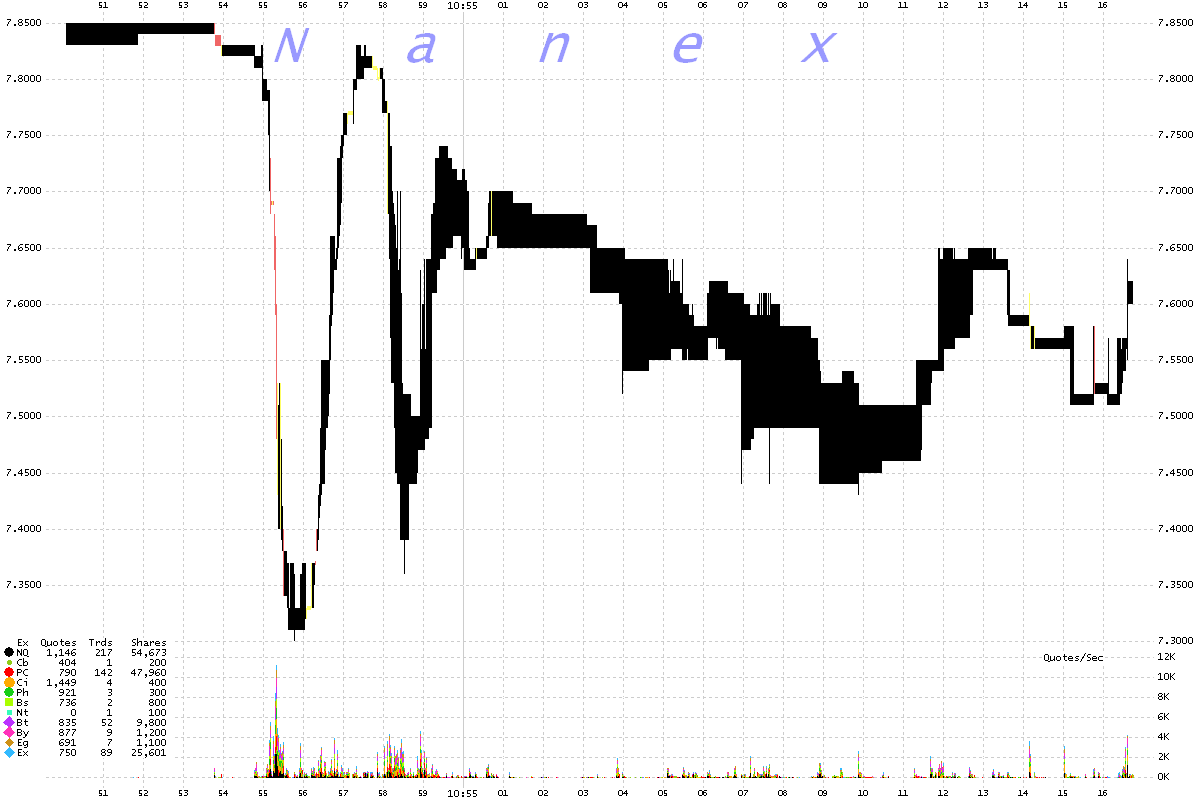
It repeated this wild oscillation over the next two seconds but only sweeping through a 6% swing.
Anyone looking on a 1 second interval chart would have seen a single price spike.
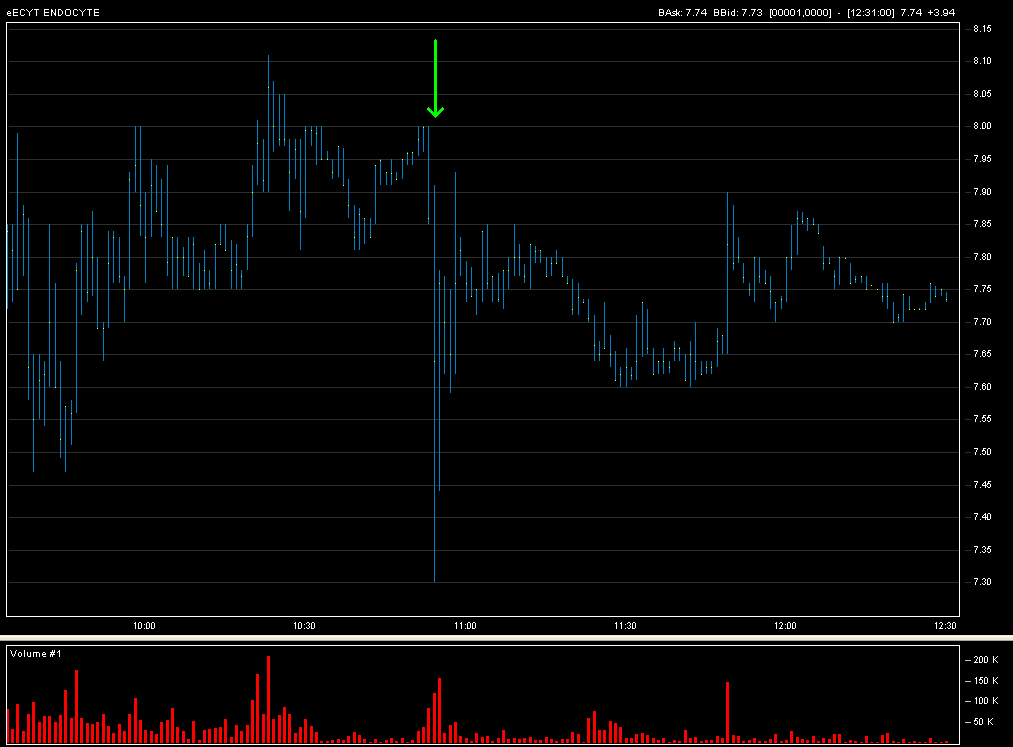
ECYT 1 minute interval chart.
The green arrow points to where the wild price oscillation occurred.
ECYT 1 second interval chart. Chart shows 17 minutes of data.
The green arrow points to where the wild price oscillation occurred. The
NBBO is plotted in black for a normal market, yellow if bid equals ask and red if
bid is greater than ask.
ECYT 25 millisecond chart. Chart shows 26 seconds of data.
At this resolutiuon, we can see the wild oscillation.
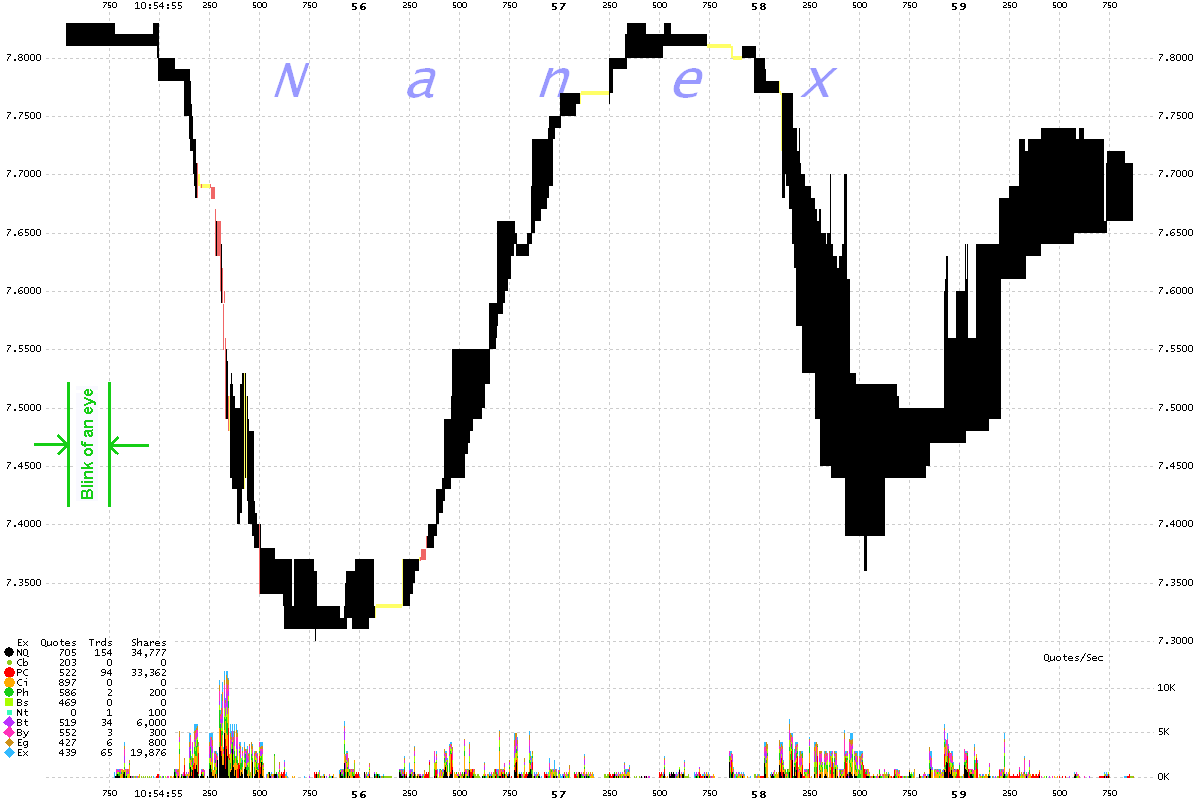
ECYT 5 millisecond chart. Chart shows 5 seconds of data.
Note the quote rate exceeds 10,000/second when the NBBO is crossed during
the first drop (red shading).
ECYT tick chart.
How to read this chart.
Nanex Research


