Nanex Research

Nanex ~ NLY Event on July 29, 2011
On Friday, July 29, shares of several REIT's plummeted and then quickly recovered
near market open, which we first covered
here. In April 2012, a reader, who was a victim of this sudden market vacuum,
sent us trade execution information for stops that were triggered in several of the
affected stocks. One of those stocks was NLY. When we looked for where this readers
trade execution took place, we found what appears to be a system problem at NYSE around
the time of a LRP (Liquidity
Replenishment Point) was triggered.
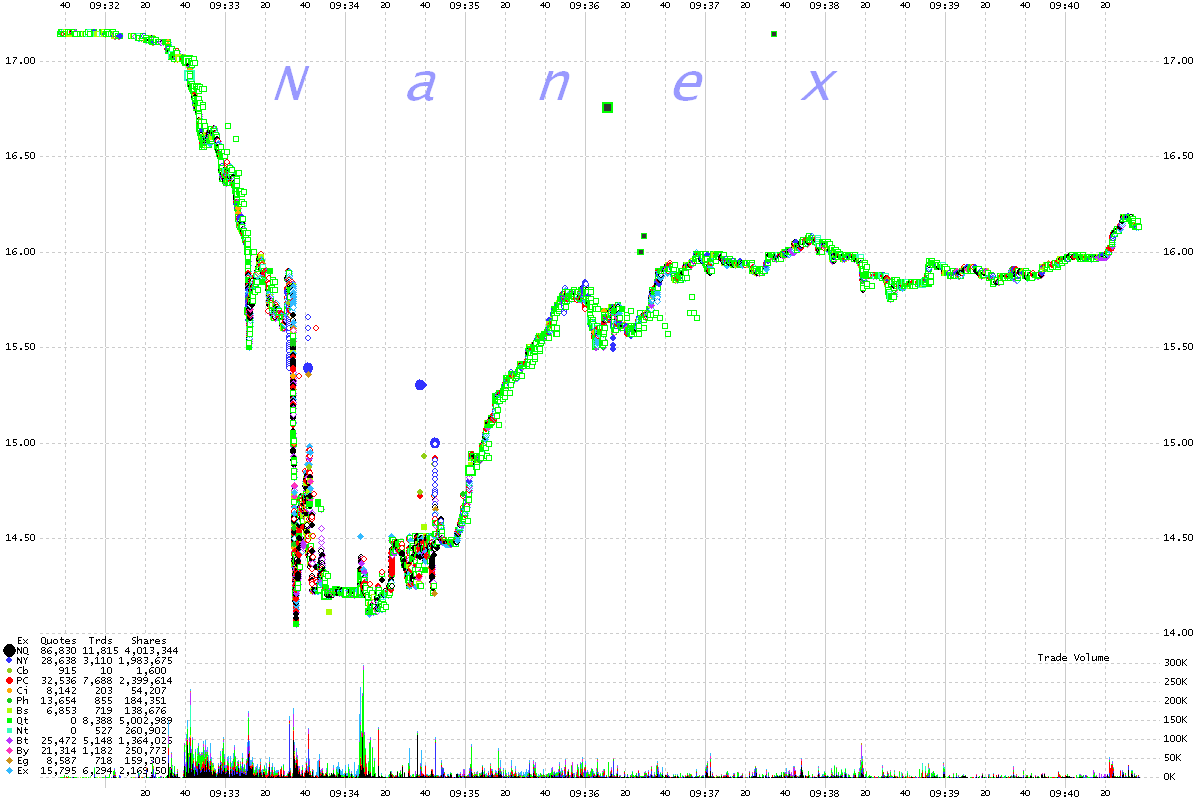
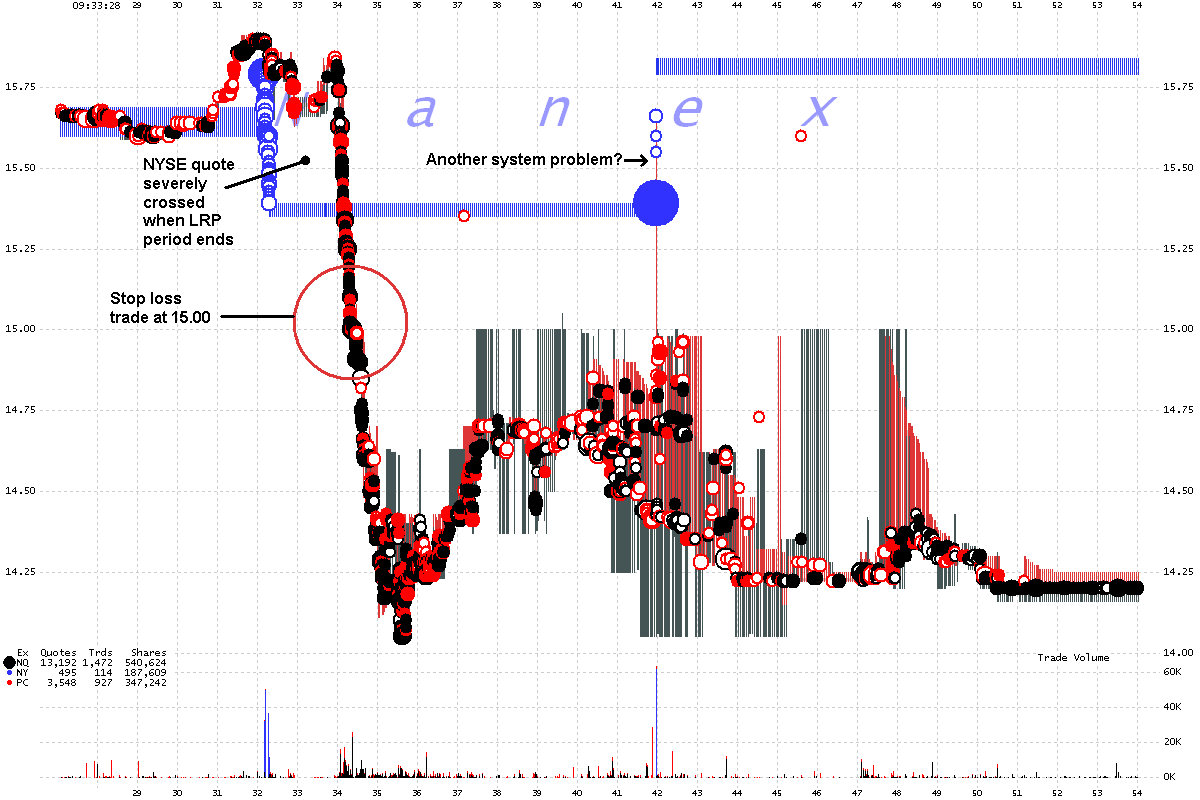
NLY 500 millisecond interval chart showing trades color coded by exchange.
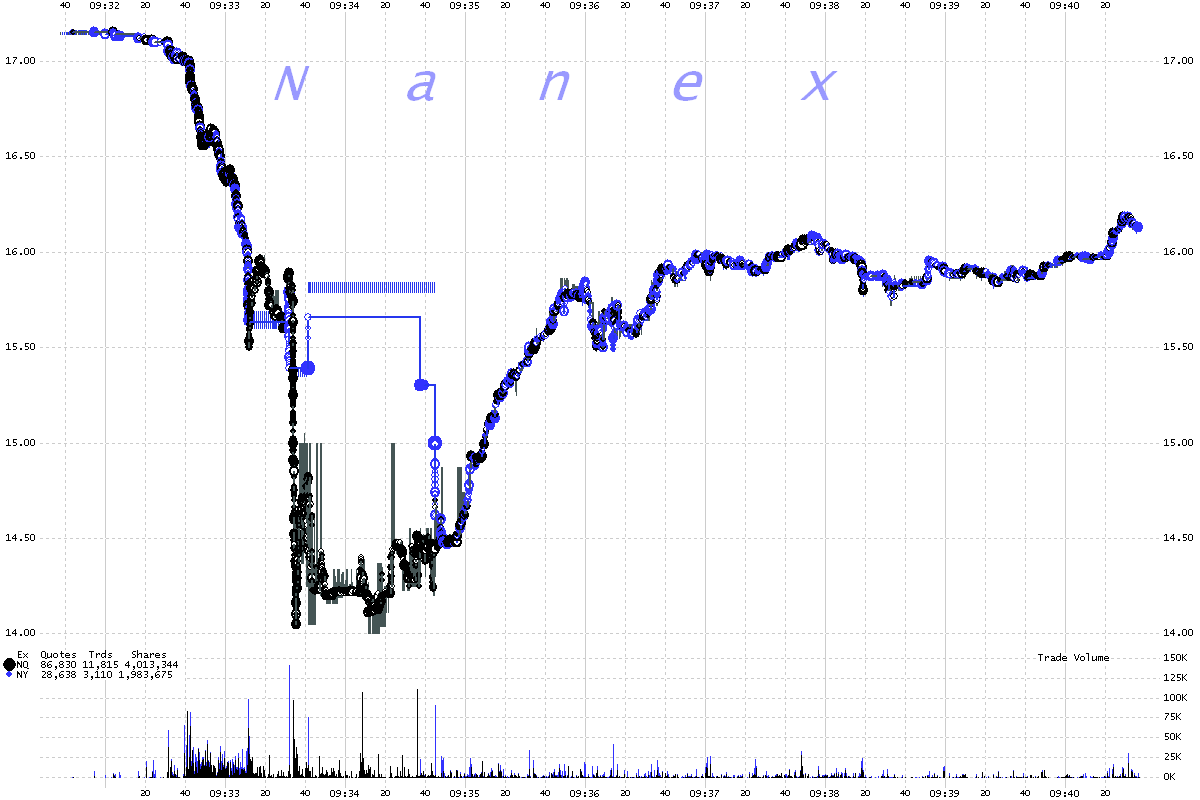
NLY 500 millisecond interval chart showing trades and quote spread for Nasdaq
(black) and NYSE (blue).
We removed the other exchange data for clarity. Note the apparent severe
delay at NYSE.
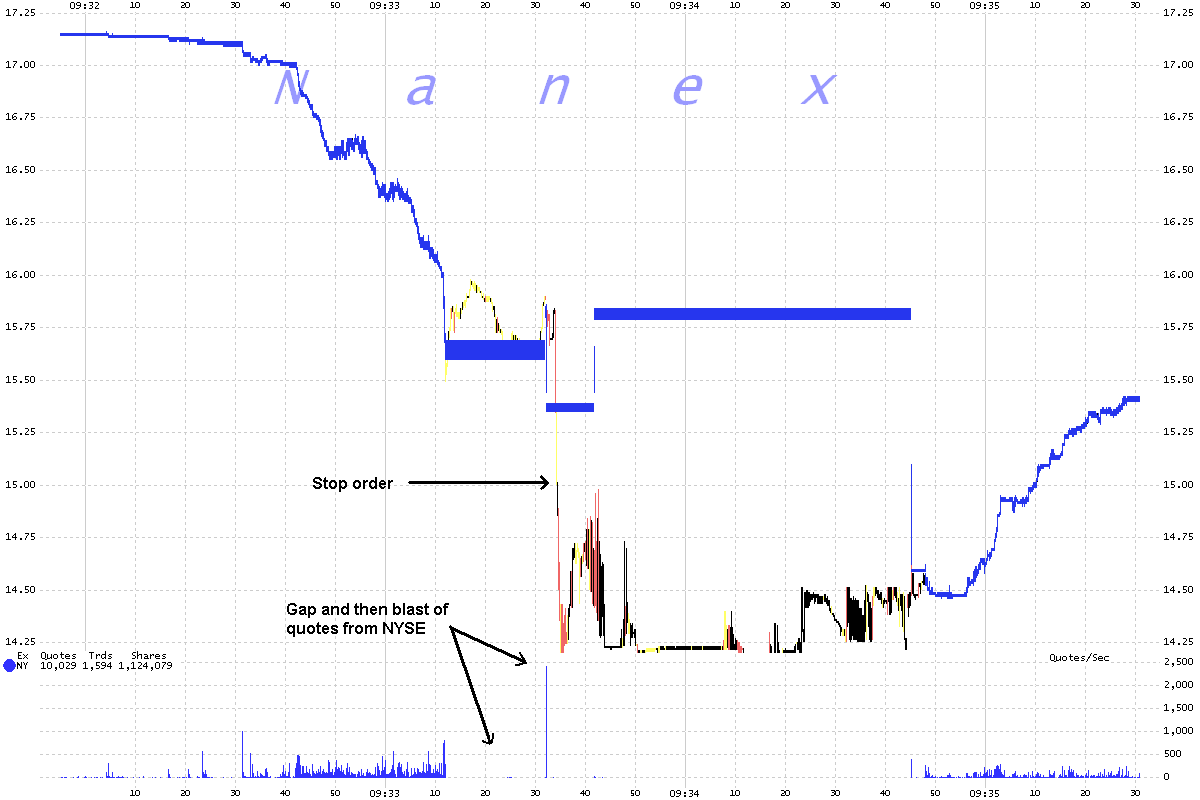
NLY 200 millisecond interval chart showing the NYSE quote spread (blue) along
with the NBBO.
The NBBO is shaded gray for normal, yellow for locked (bid = ask) and red
for crossed (bid > ask).
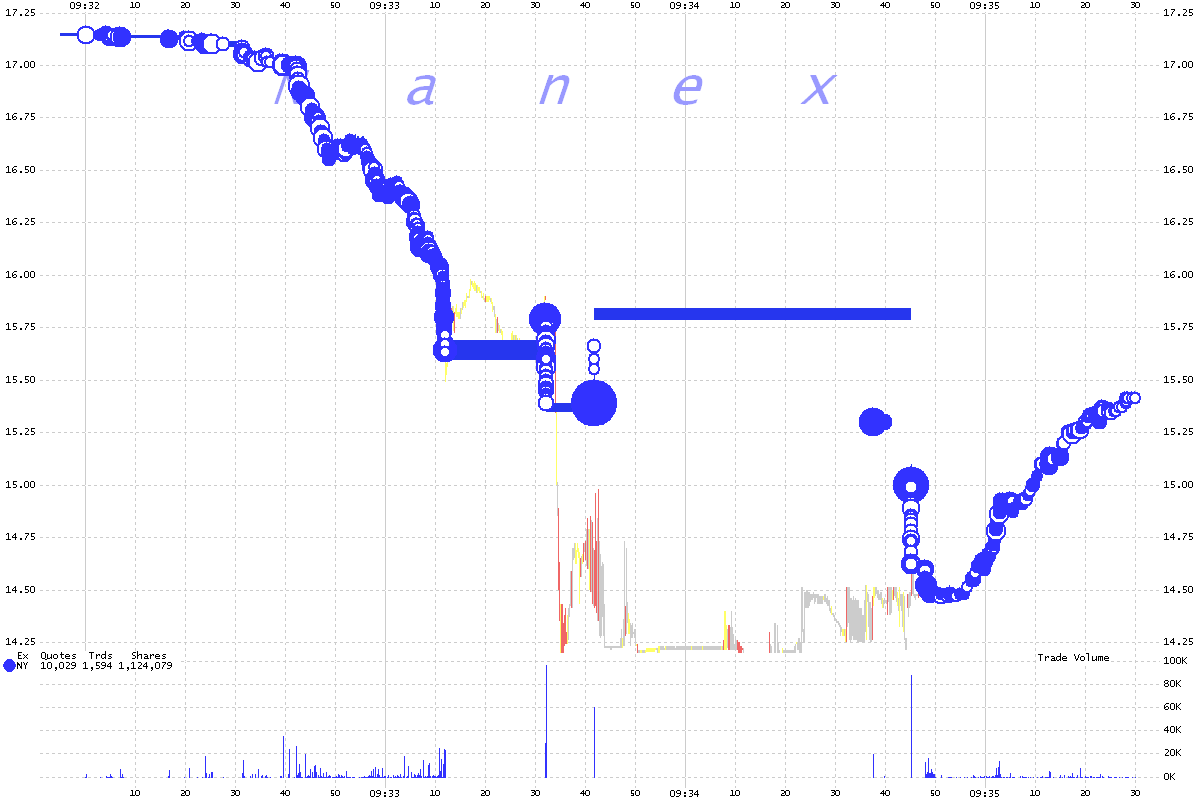
NLY 200 millisecond interval chart showing the NYSE quote spread (blue) and
trades along with the NBBO.
This chart is the same as the above plus the addition of NYSE trades.
NLY 25 millisecond interval chart showing the trades and quotes from NYSE,
ARCA and Nasdaq.
Zooming in for detail.
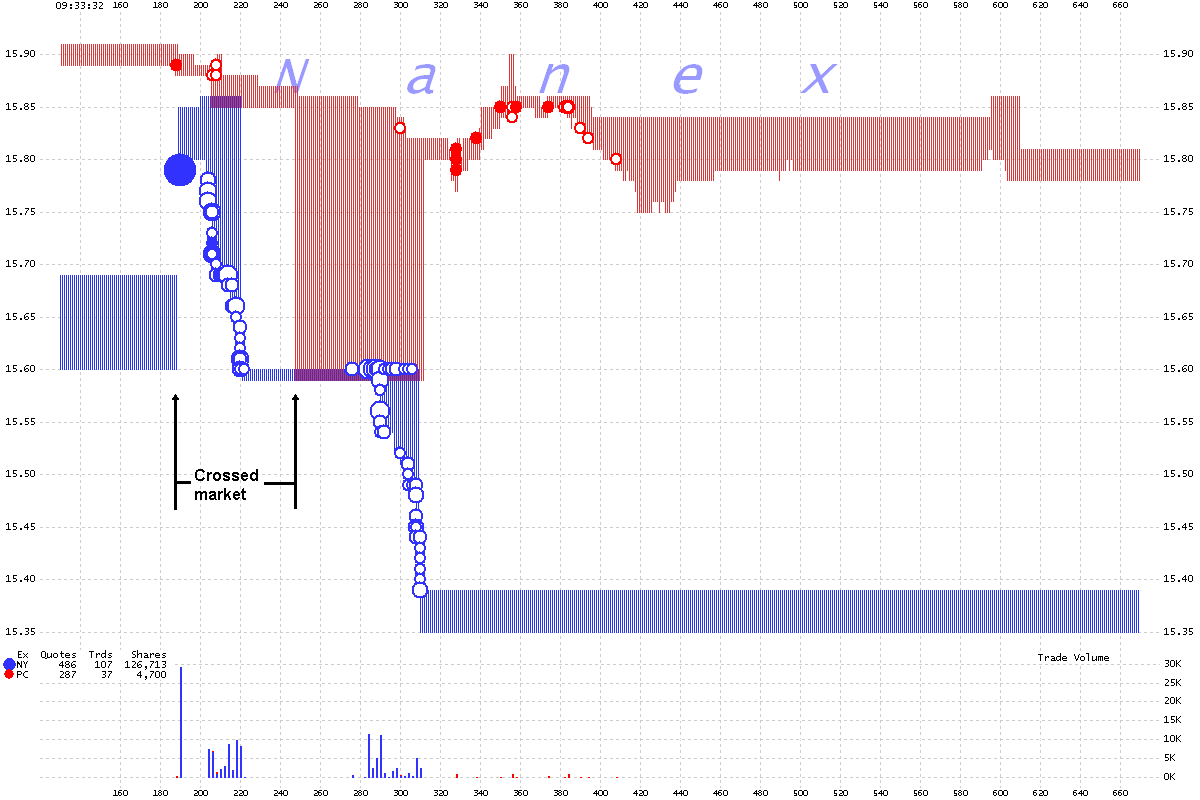
NLY 1 millisecond interval chart showing the trades and quotes from NYSE and
ARCA.
Zooming in for detail.
Nanex Research


