Nanex Research

Nanex ~ Lemmings off a cliff
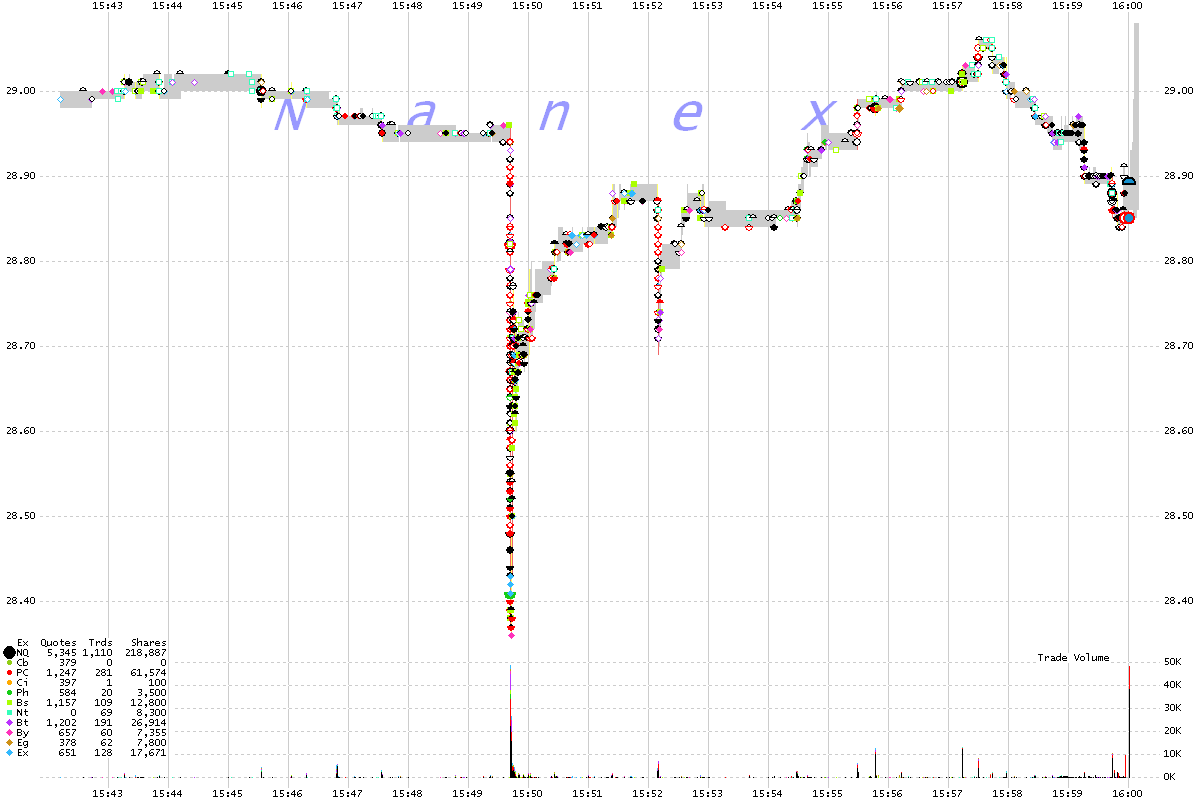
On Friday, April 20, 2012, Lamar Advertising Co (LAMR) suddenly dropped 2% in about 1/2 second. The stock
fully recovers within minutes.
Note this price spike is not simply a bad print, but trades from 10 different exchanges.
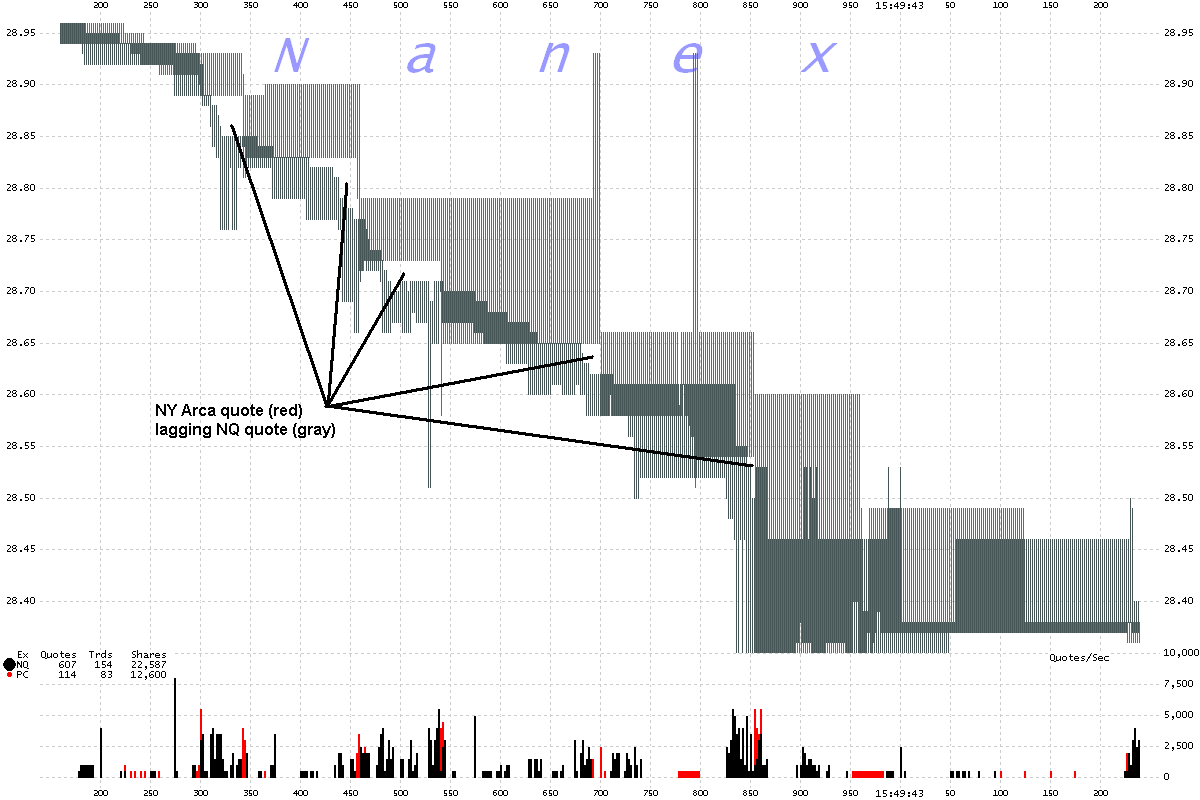
The move was so fast, ARCA's quote couldn't keep up (3rd chart).
LAMR 1 second interval chart showing trades color coded by exchange
and NBBO.
NBBO shaded gray for normal, yellow for locked (bid = ask) or red for crossed (bid
> ask).

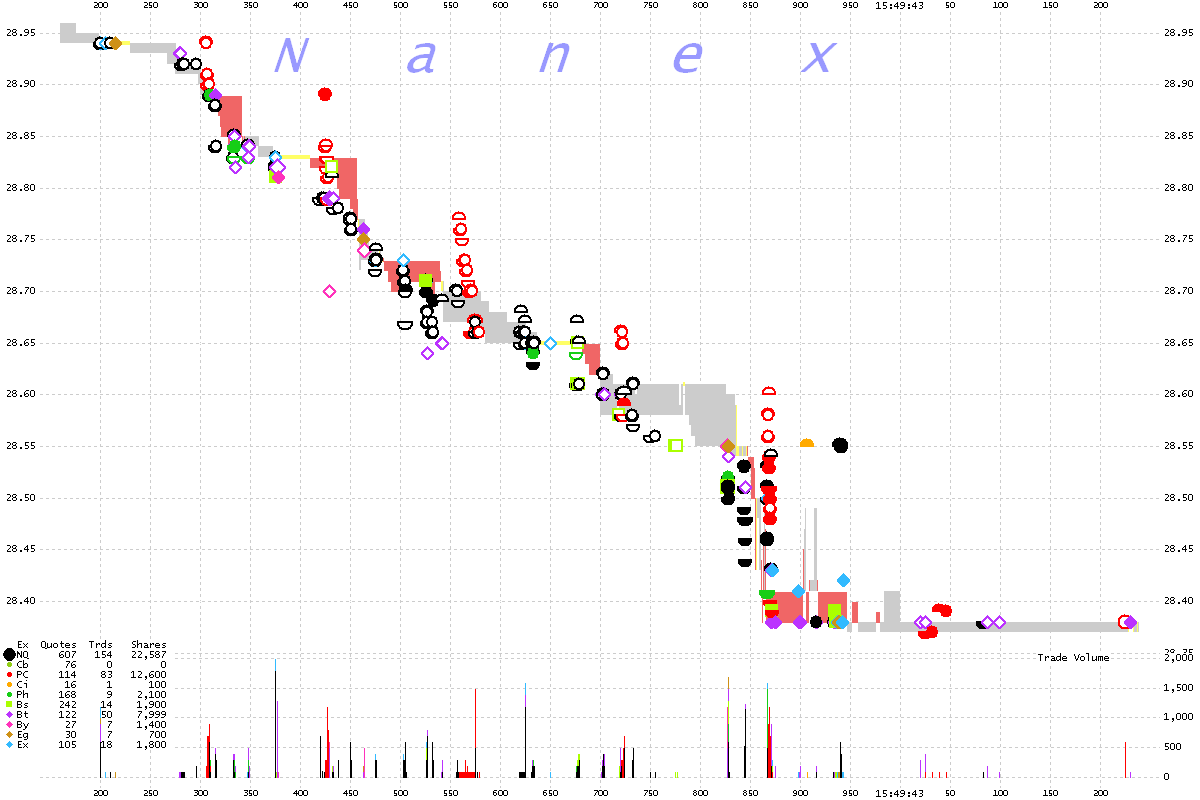
LAMR 1 millisecond interval chart showing best bid and offers color coded
by exchange plus NBBO. Chart shows 1 second of data.
NBBO shaded gray for normal, yellow for locked (bid
= ask) or red for crossed (bid > ask).
Note how the exchanges all follow each other 2% lower in about 1/2 second.

LAMR 2 millisecond interval chart showing bid/ask spread for Nasdaq (gray)
and ARCA (red). Chart shows 1 second of data.
Note how even ARCA isn't able to keep up with the speed of this decline -- here we
can see 5 instances where ARCA's bid price exceeded Nasdaq ask price.

LAMR 1 millisecond interval chart showing Trades and NBBO. (Zoom of top chart). This chart shows just 1 second of data.
Note how the drop has trades from 10 different exchanges. All following each other
down.

Nanex Research


