Nanex Research

Nanex ~ 04-May-2012 ~ UOIL Wild quotes
Looking at quotes on the stock symbol UOIL (an oil related ETF) makes us wonder who in their
right mind would allow this.
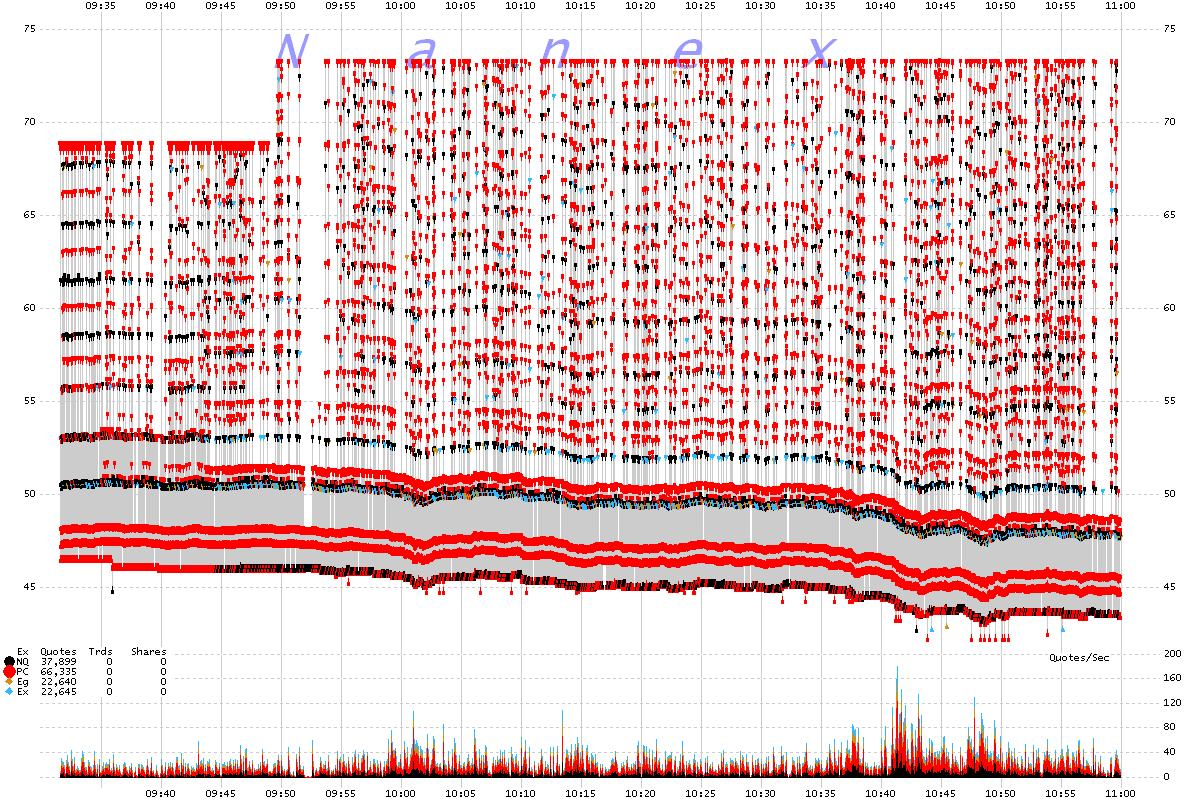
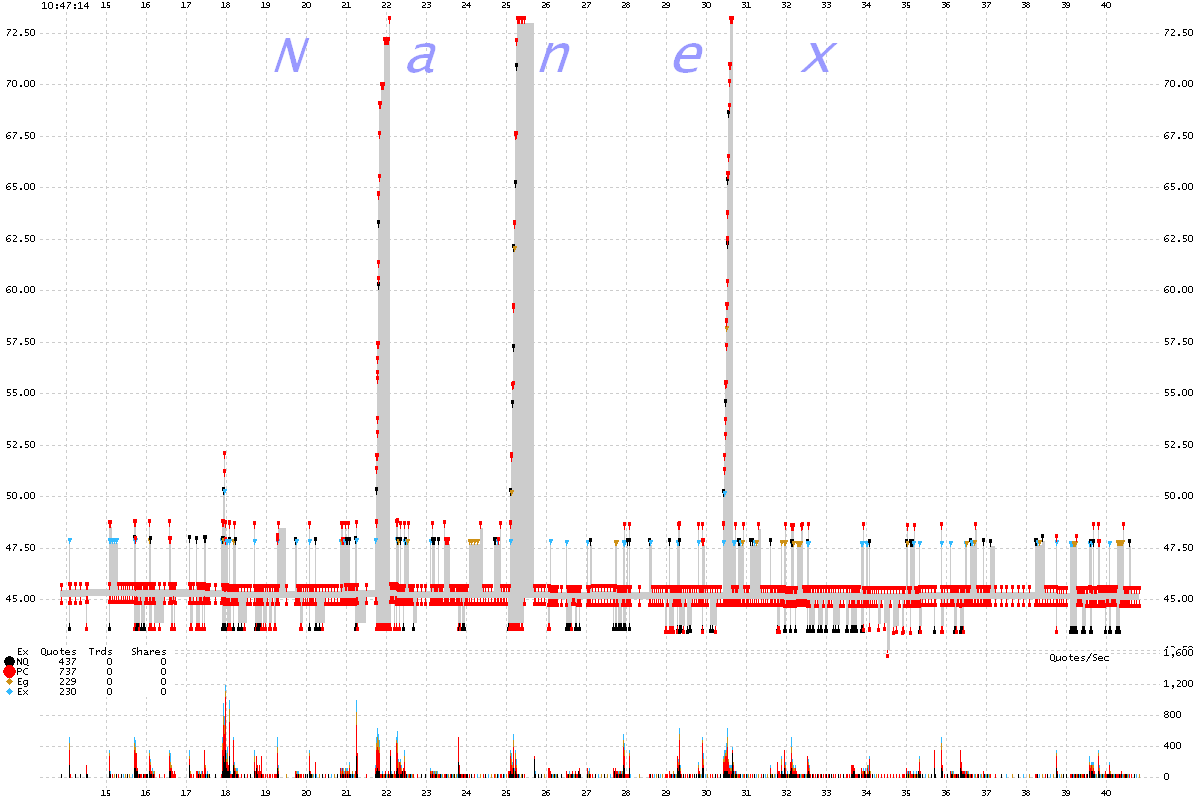
If you wanted to buy this "stock", the price could change
from $48 to $73. Suddenly.
For no economic reason whatsoever.
And it does this every few seconds.
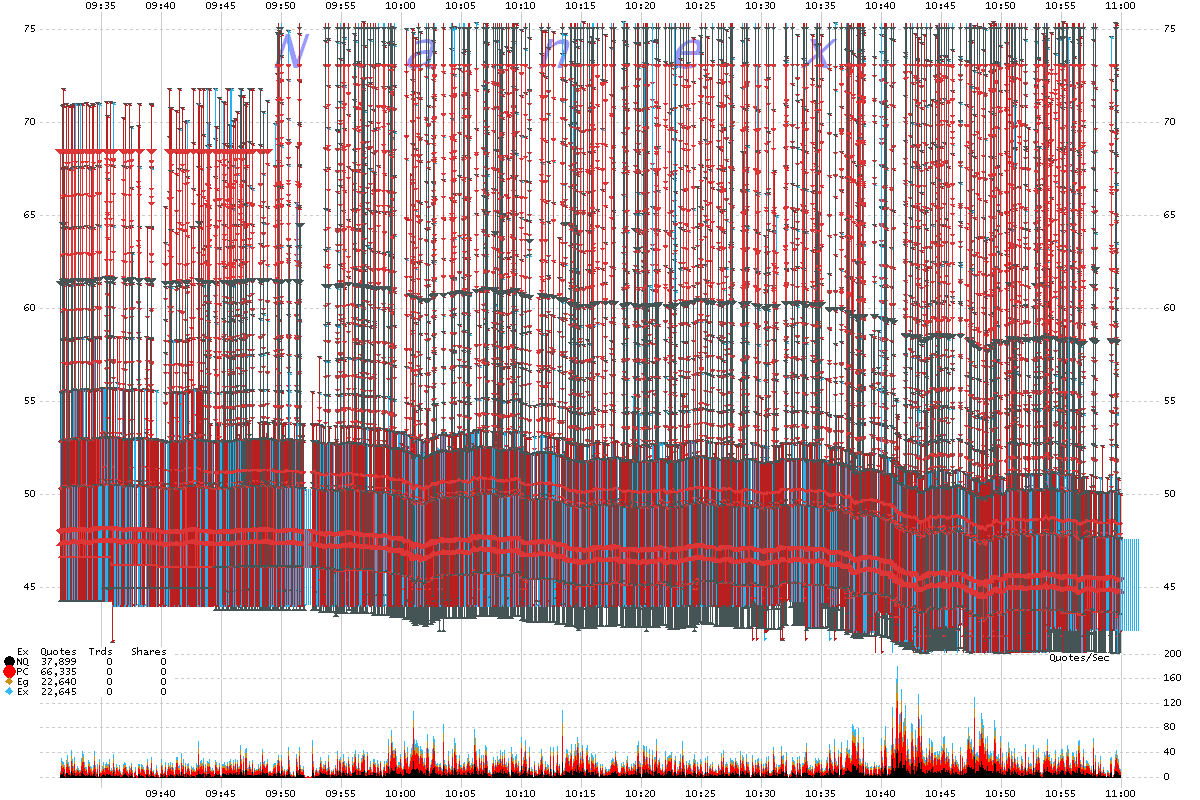
There are exactly zero trades during the 90 minutes shown in the charts below. Probably
for good reason.
UOIL 5 second interval chart showing best bids (up triangles) and best offers (down
triangles) color coded by exchange. The thin gray line is the quote spread.

UOIL 5 second interval chart showing all exchange bids (up triangles) and offers (down
triangles) color coded by exchange.

UOIL 25 millisecond interval chart showing best bids (up triangles) and best offers (down
triangles) color coded by exchange. The thin gray line is the quote spread.

Nanex Research


