Nanex Research

Nanex ~ 07-May-2012 ~ CZR New Normal
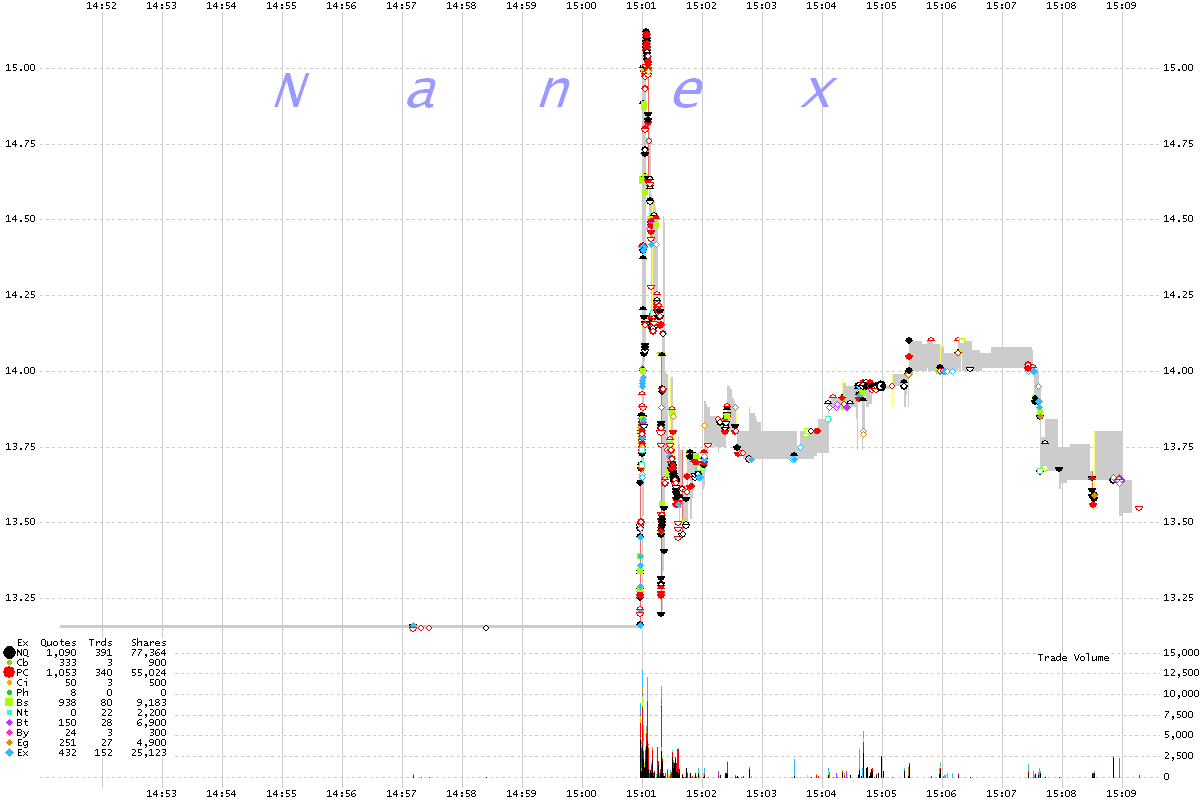
CZR 1 second interval chart showing trades color coded by exchange. The thin
gray line is the NBBO quote spread.

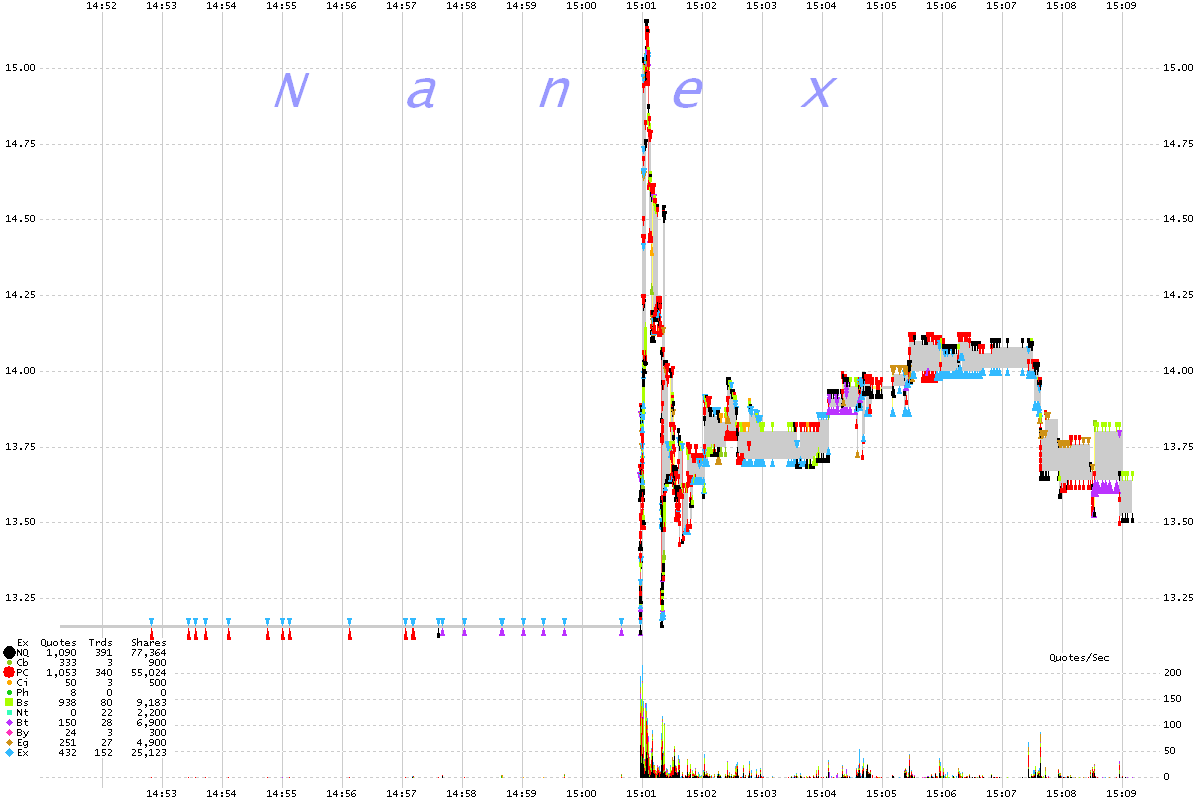
CZR 1 second interval chart showing best bids and offers color coded by exchange.
The thin gray line is the NBBO quote spread.

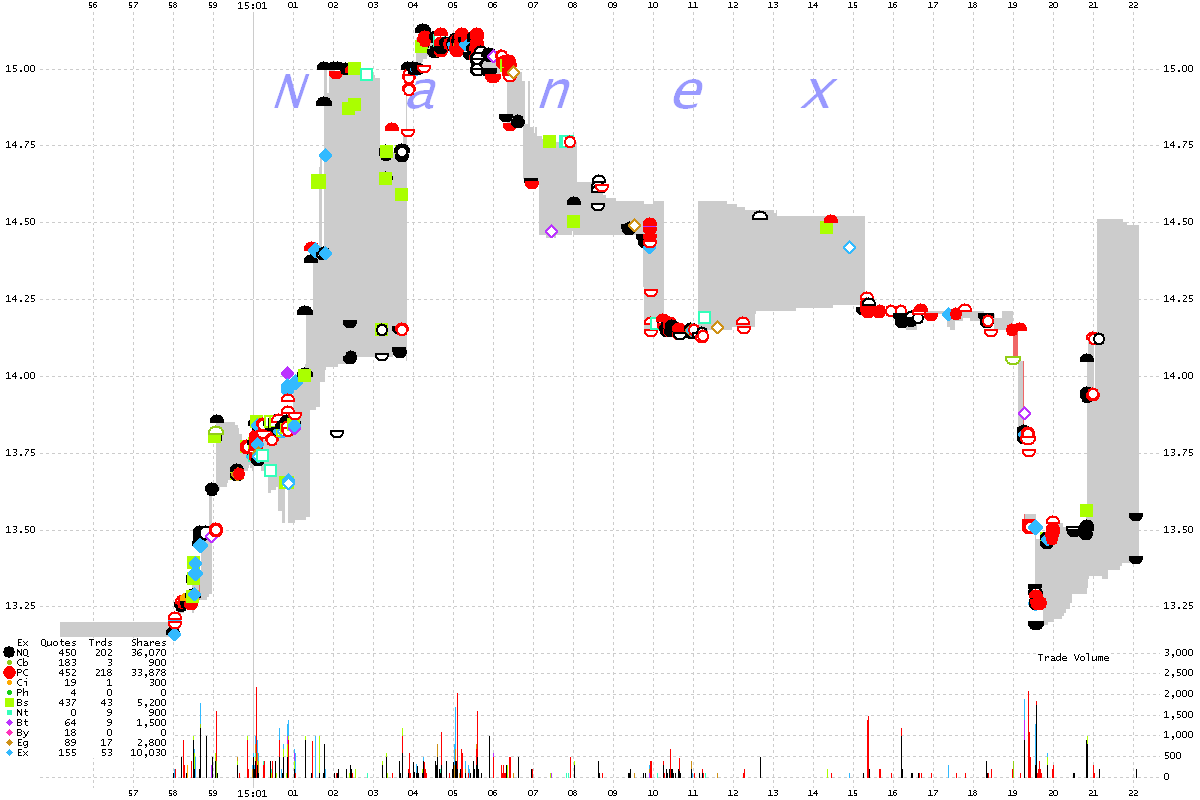
CZR 25 millisecond interval chart showing trades color coded by exchange.
The gray area is the NBBO quote spread.

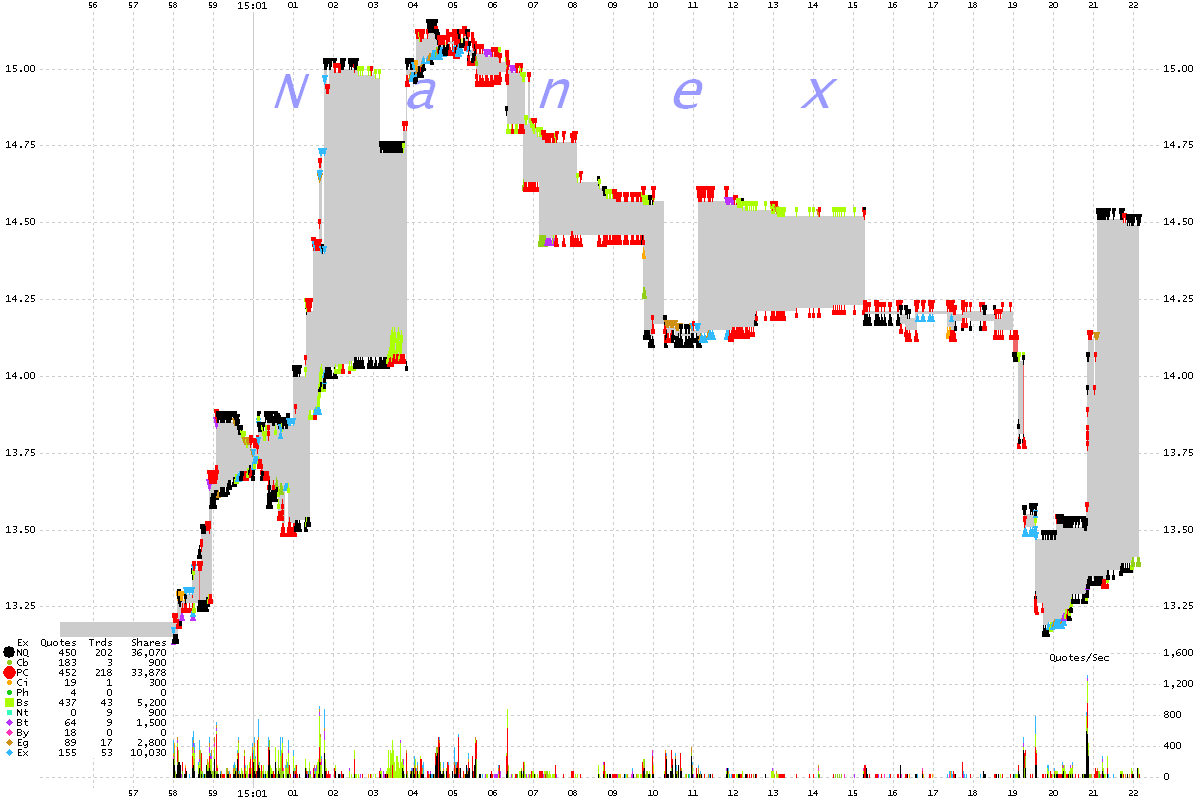
CZR
25 millisecond interval chart showing best bids and offers color
coded by exchange. The gray area is the NBBO quote spread.

Nanex Research


