Nanex Research

Nanex ~ 07-May-2012 ~ Tighter Spreads?
The charts below supplement the article
Two years after the Flash Crash – Spreads are Narrower and Liquidity Deeper
than Ever Before? Guess Again by Dennis Dick.
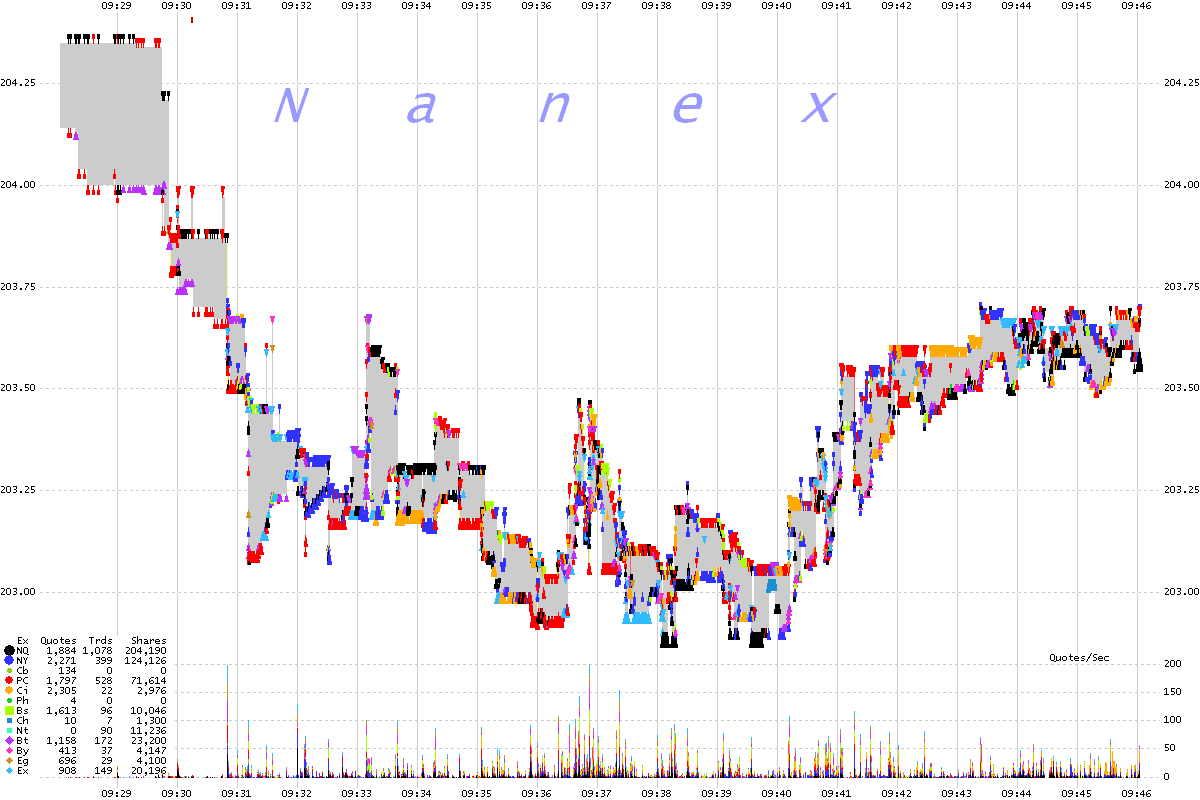
IBM 1 second interval chart showing best bids and offers color coded by exchange.
The gray area is the NBBO quote spread.
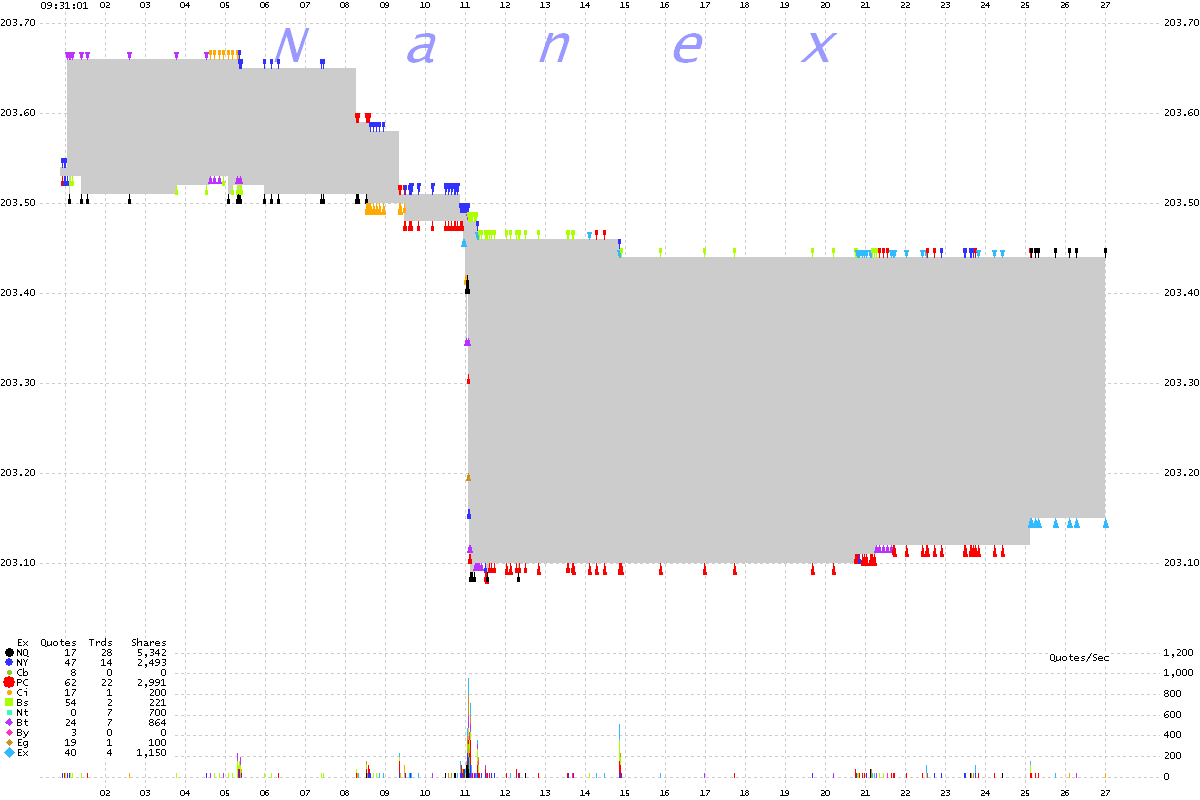
IBM 25 millisecond interval chart showing best bids and offers color coded
by exchange. The gray area is the NBBO quote spread.
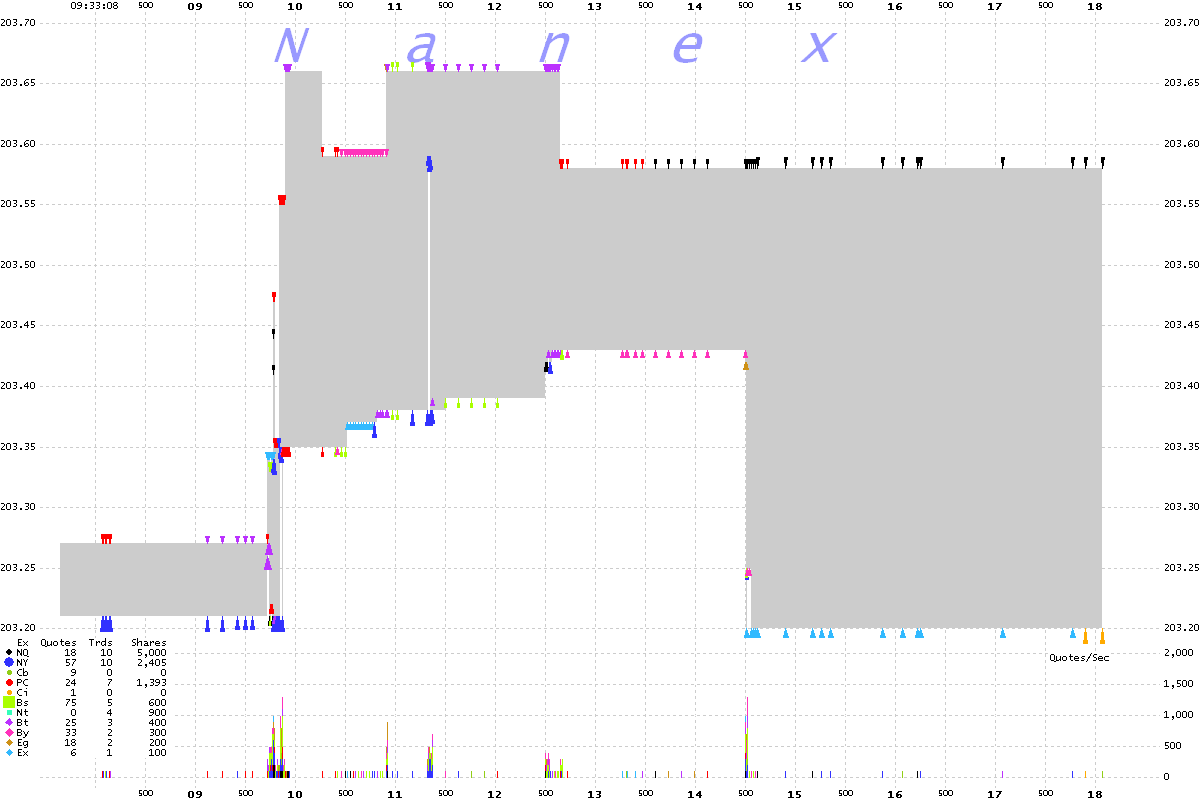
IBM 10 millisecond interval chart showing best bids and offers color coded
by exchange. The gray area is the NBBO quote spread.
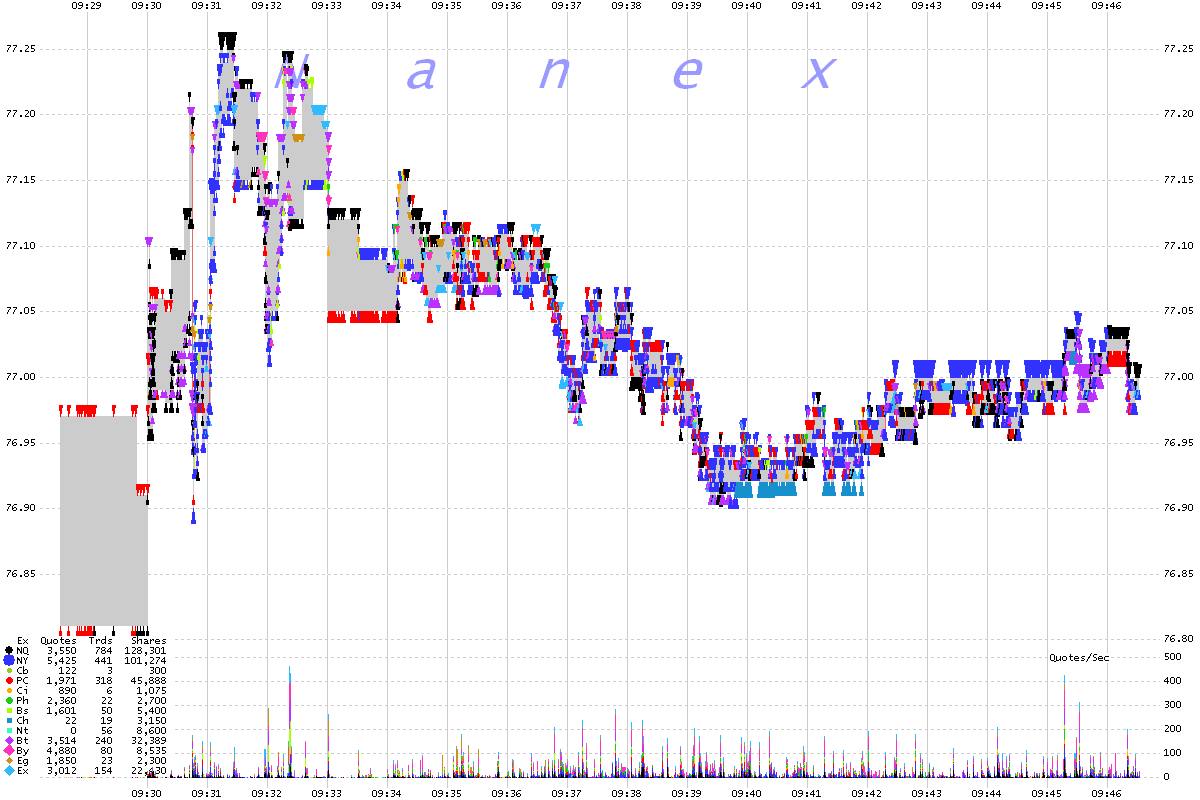
KO 1 second interval chart showing best bids and offers color coded by exchange. The gray area is the NBBO quote spread.
KO 25 millisecond interval chart showing best bids and offers color coded by exchange. The gray area is the NBBO quote spread.
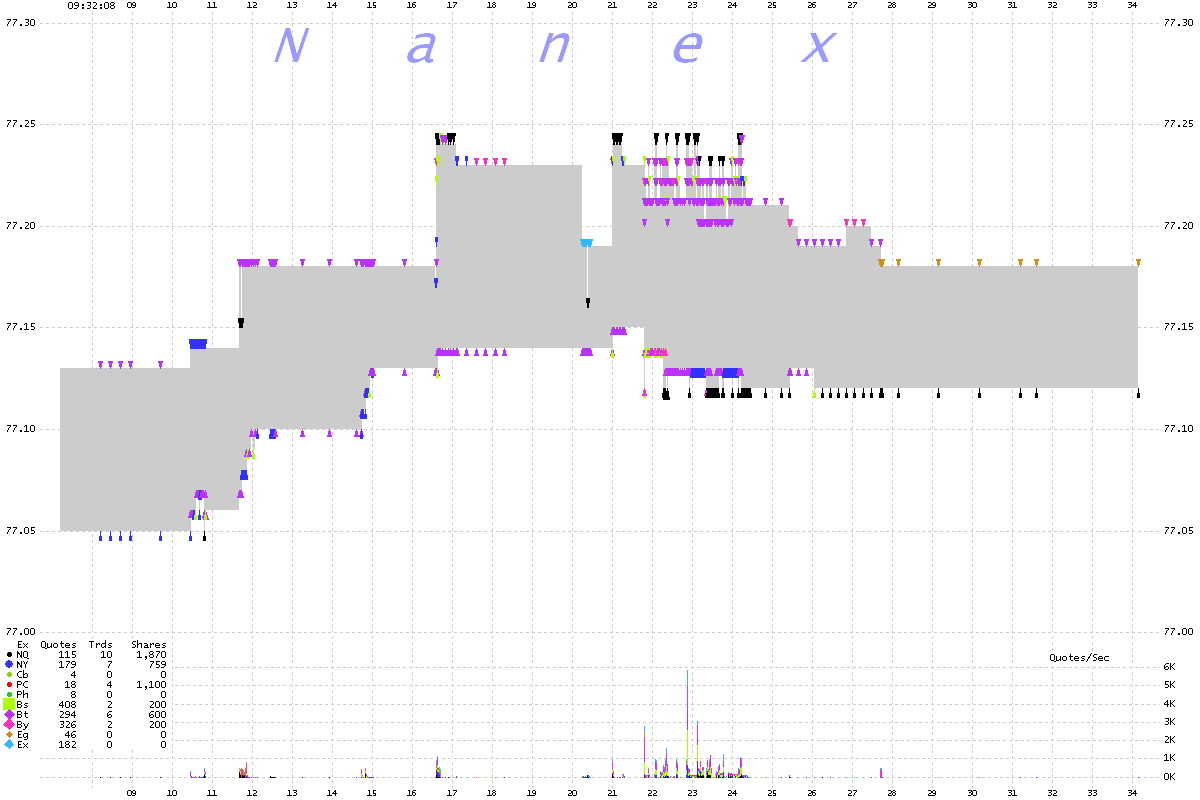
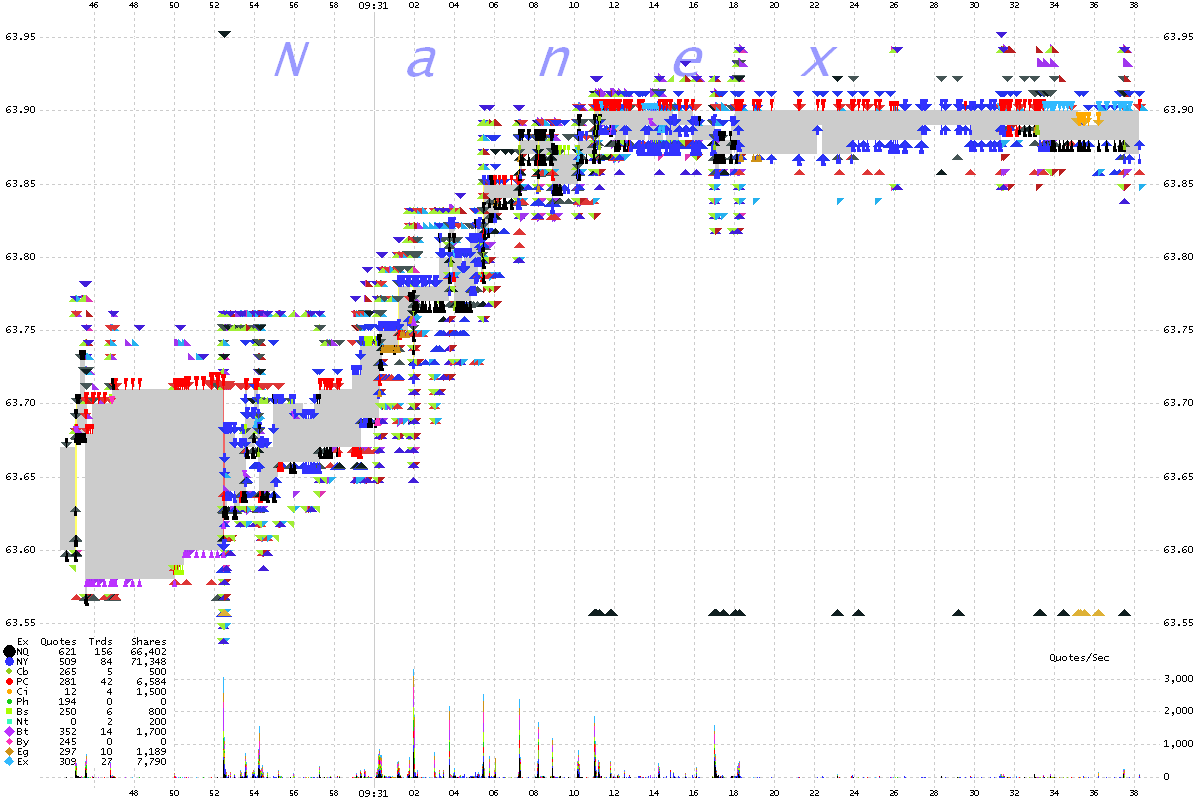
KO 25 millisecond interval chart showing all exchange bids and offers color coded by exchange. The gray area is the NBBO quote spread.
Note: This is the same chart as above but includes quotes from all exchanges.
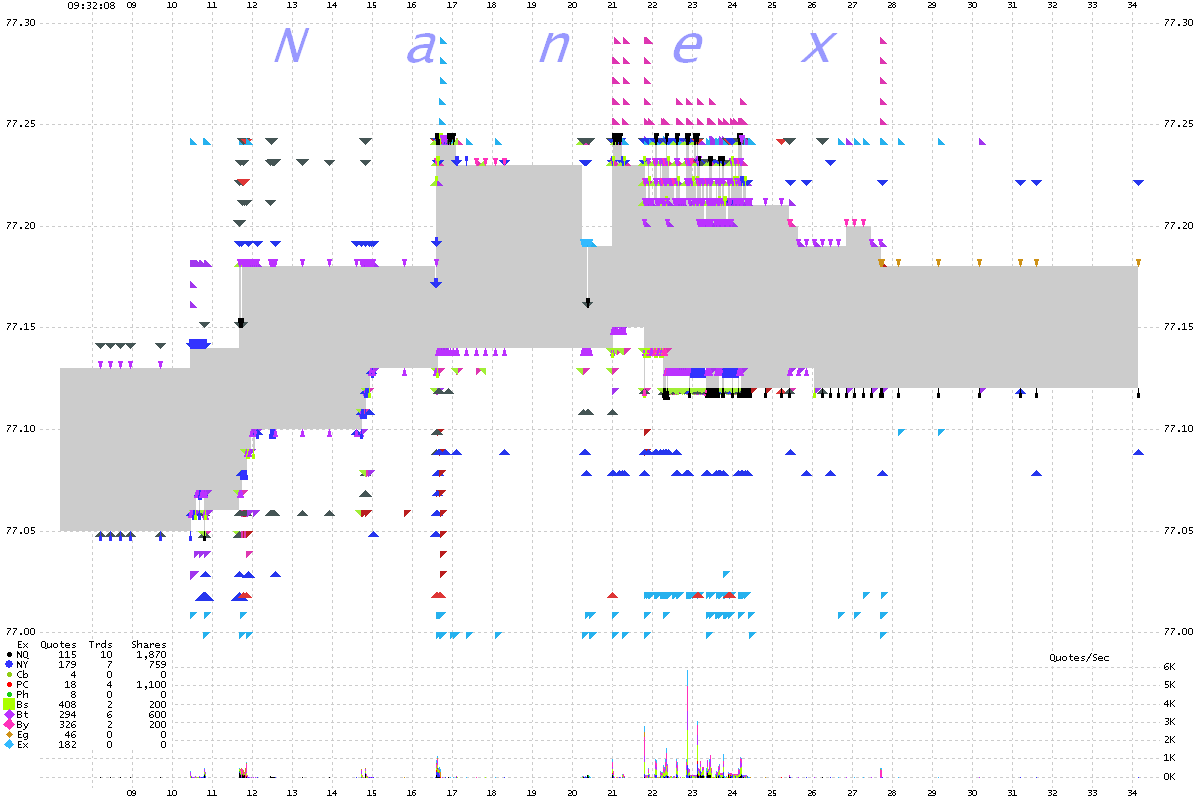
KO 1 millisecond interval chart showing best bids and offers color coded by exchange. The gray area is the NBBO quote spread.
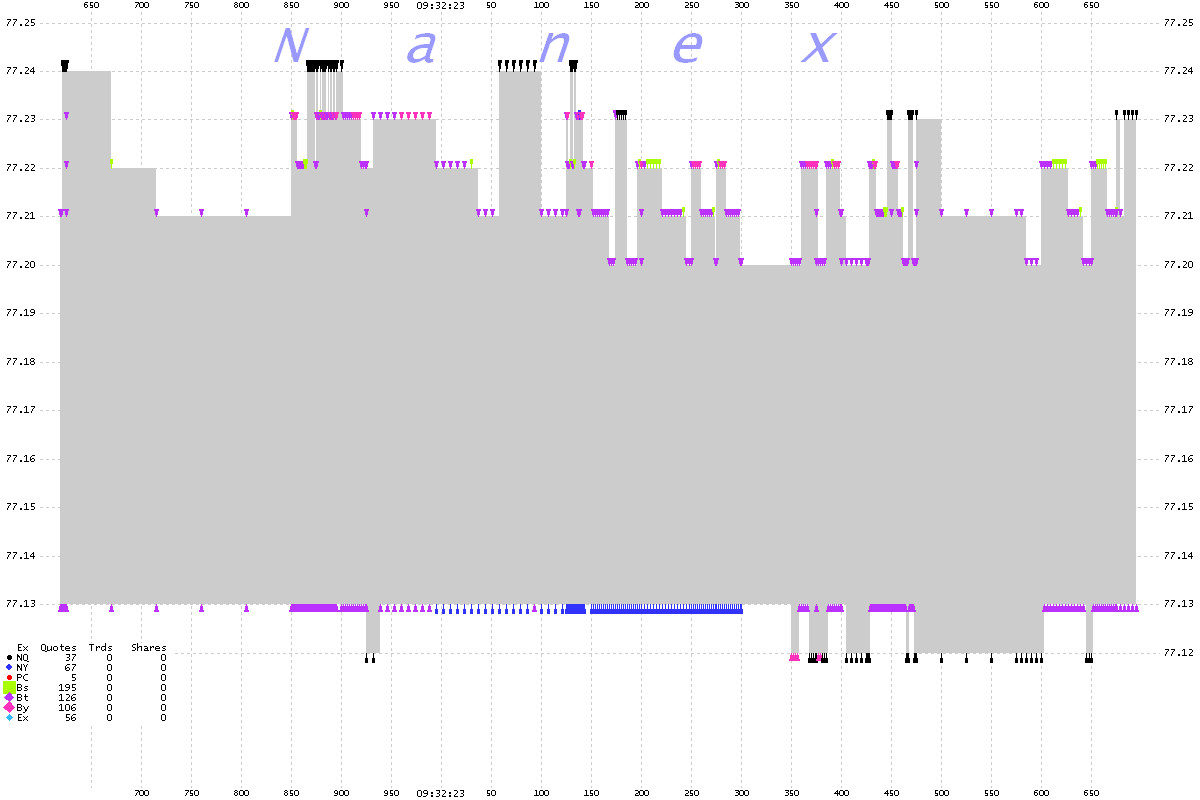
MMM 1 second interval chart showing best bids and offers color coded by exchange. The gray area is the NBBO quote spread.
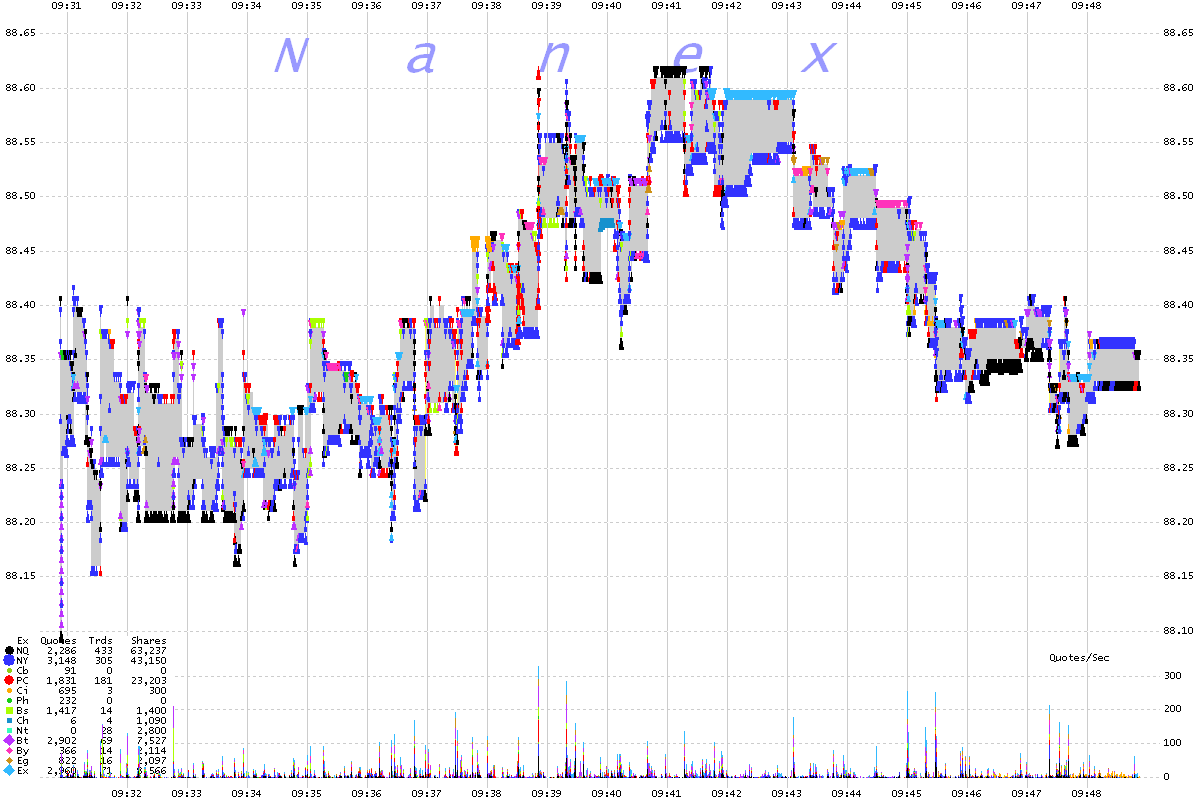
MMM 1 second interval chart showing all bids and offers color coded by exchange.
The gray area is the NBBO quote spread.
Note: This is the same chart as above but includes quotes from all exchanges.
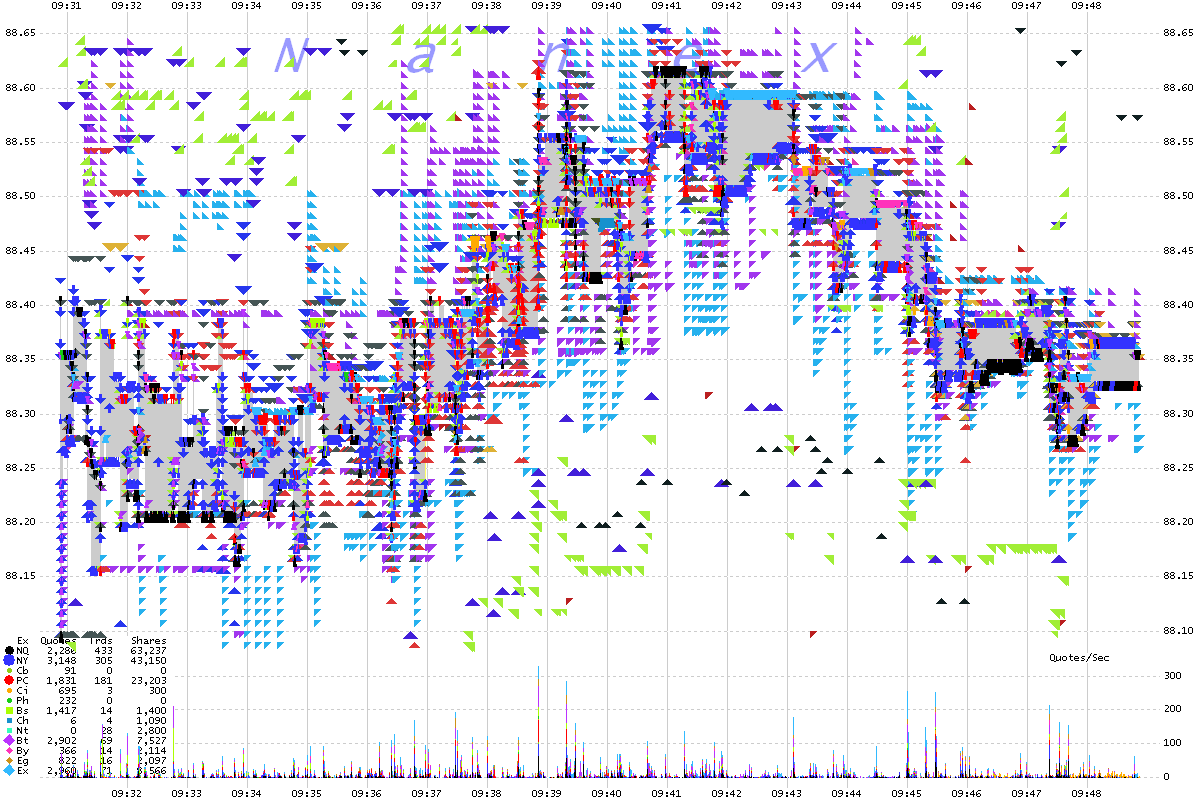
MMM 25 millisecond interval chart showing best bids and offers color coded
by exchange. The gray area is the NBBO quote spread.
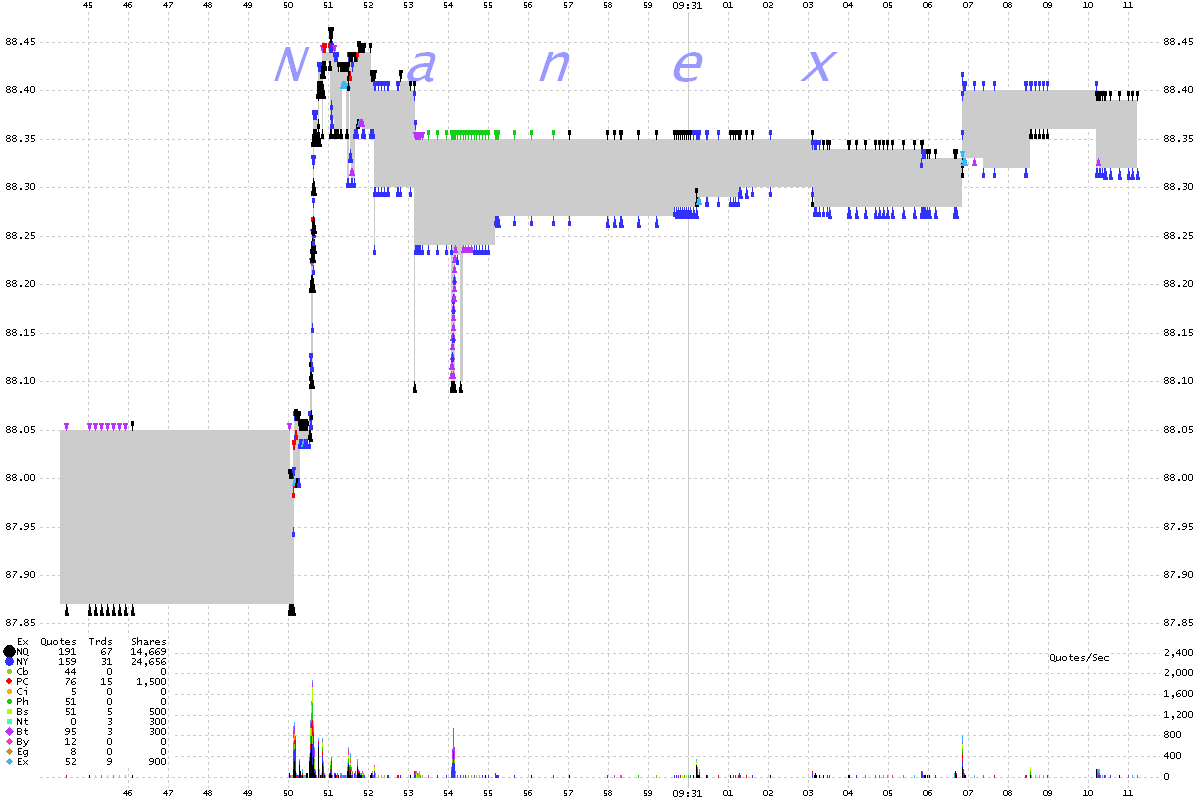
PG 1 second interval chart showing best bids and offers color coded by exchange. The gray area is the NBBO quote spread.
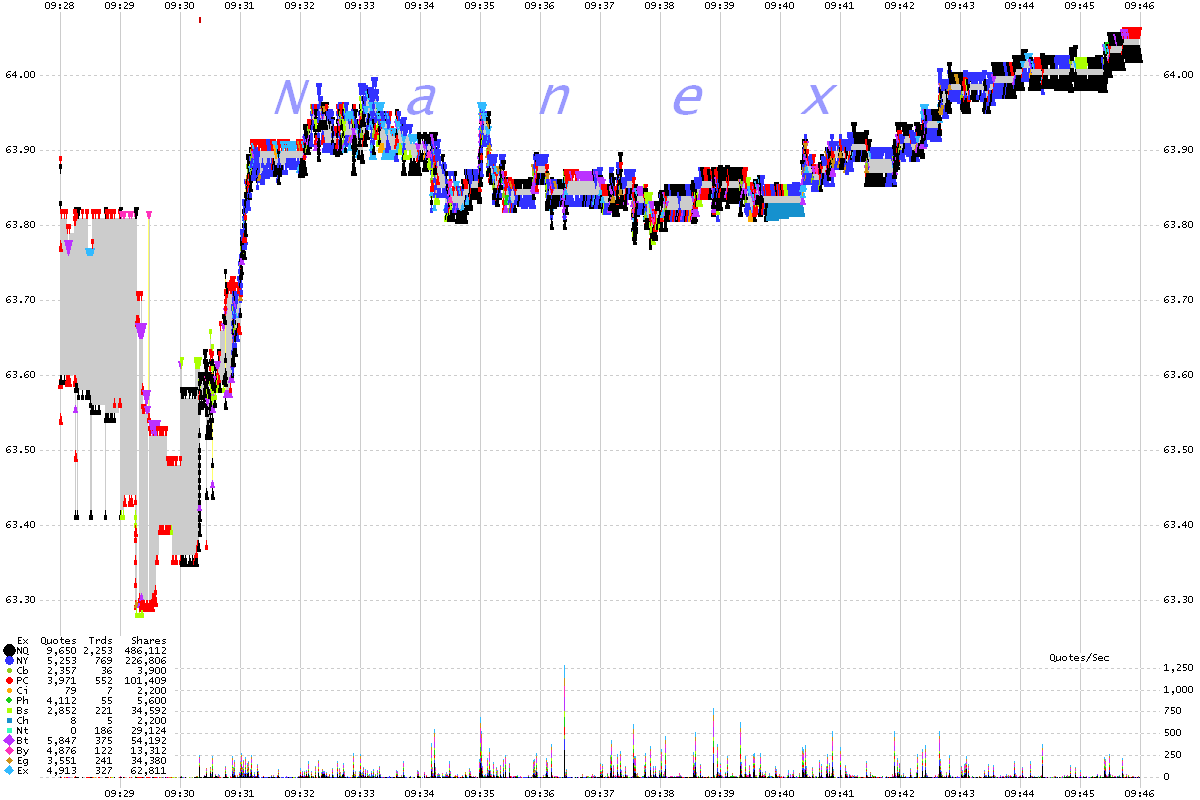
PG 50 millisecond interval chart showing best bids and offers color coded by exchange. The gray area is the NBBO quote spread.
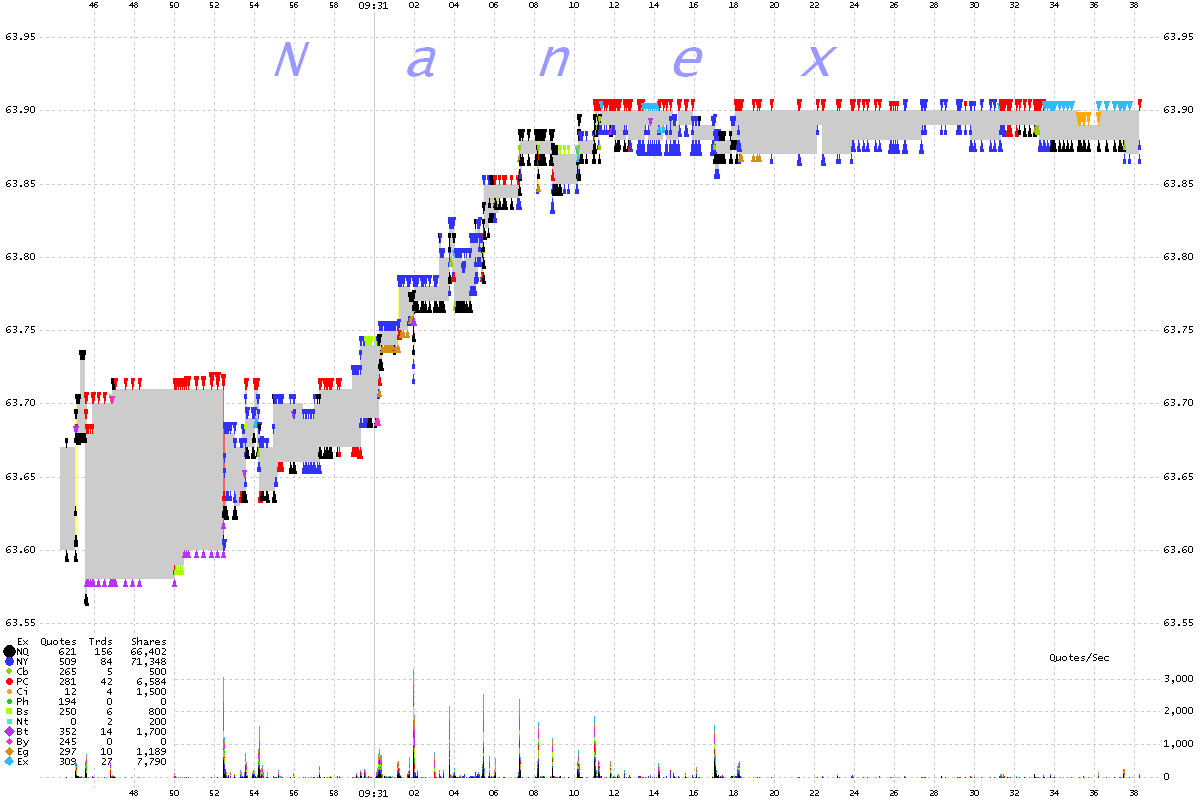
PG 50 millisecond interval chart showing all exchange bids and offers color
coded by exchange. The gray area is the NBBO quote spread.
Note: This is the same chart as above but includes quotes from all exchanges.
Nanex Research


