Nanex Research

eMini (S&P 500 electronic futures) Depth of Book
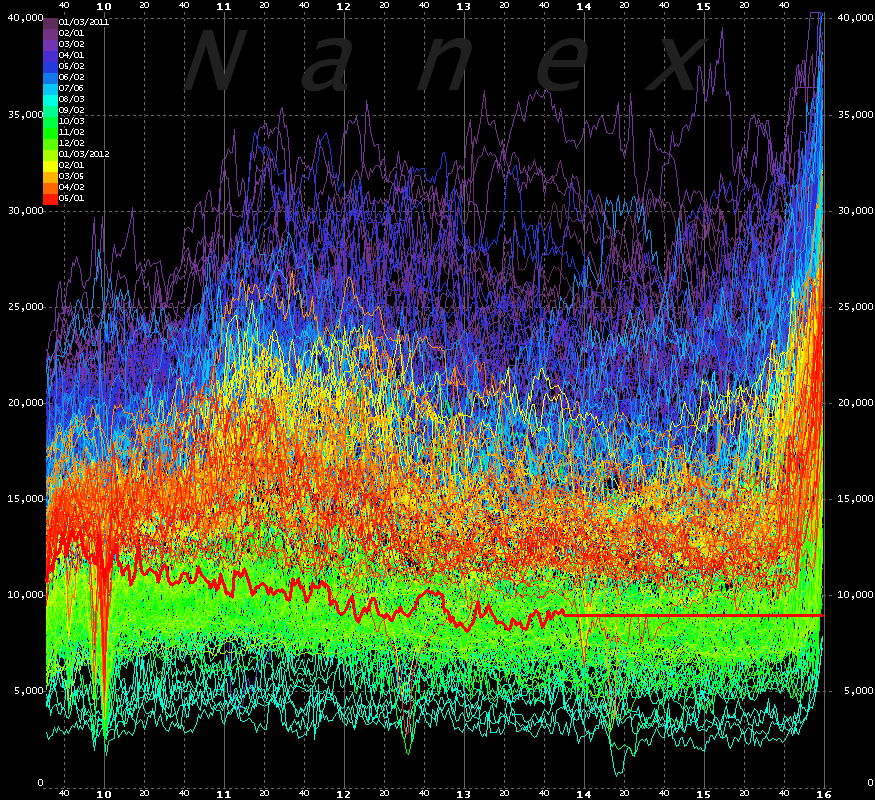
The following chart shows the total number of contracts for all 10 depth of
book levels averaged over each minute of the day between January 1, 2011 (dark purple)
and May 9, 2012 at 13:40 (bright red). Older days colored towards the violent
end of the spectrum, while more recent days colored towards the red end. May 9th
showed a significantly a significant drop after numerous instantaneous large buy and sell
orders ripped through 3 or more levels of depth. See also
HFT is Killing the EMini.

Nanex Research

