Nanex Research

Nanex ~ 16-May-2012 ~ Time to quote stuff and test exchange computers processing
symbols starting with G.
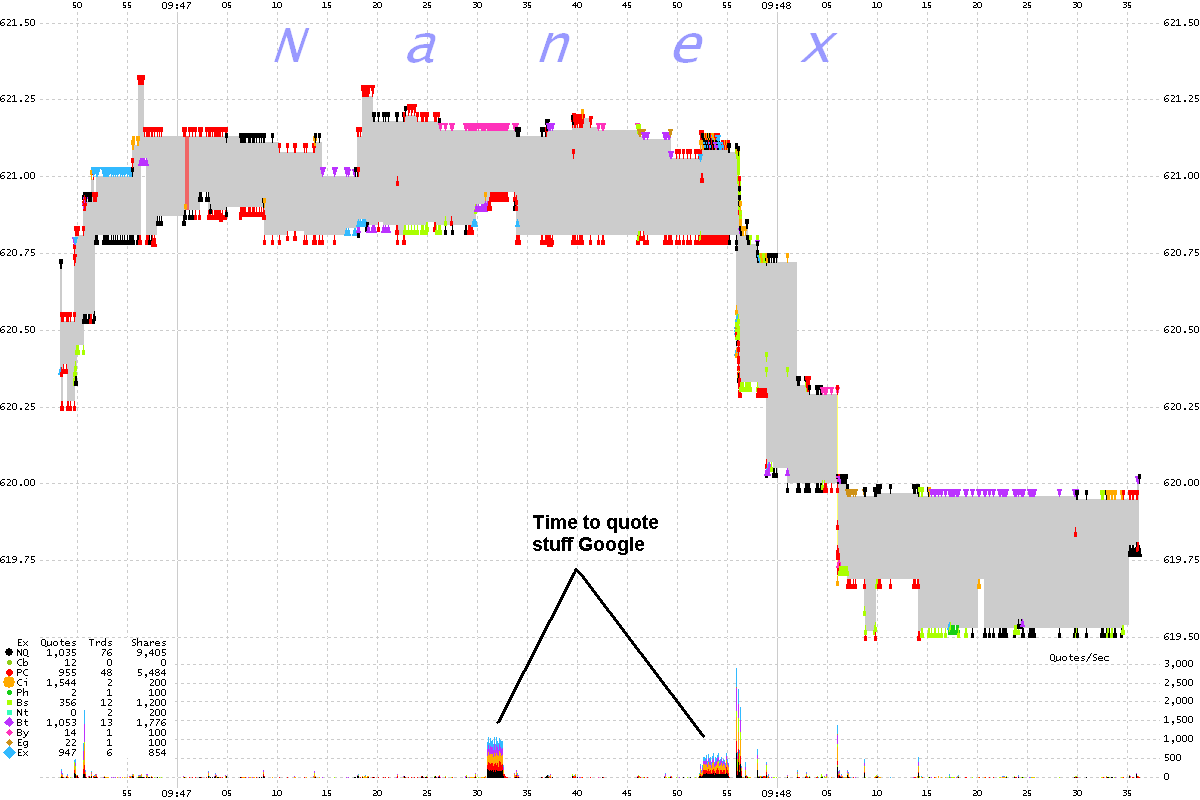
Google (GOOG) 100 millisecond interval chart showing best bids and asks color coded by exchange.
Chart shows 1 minute and 46 seconds of trading.

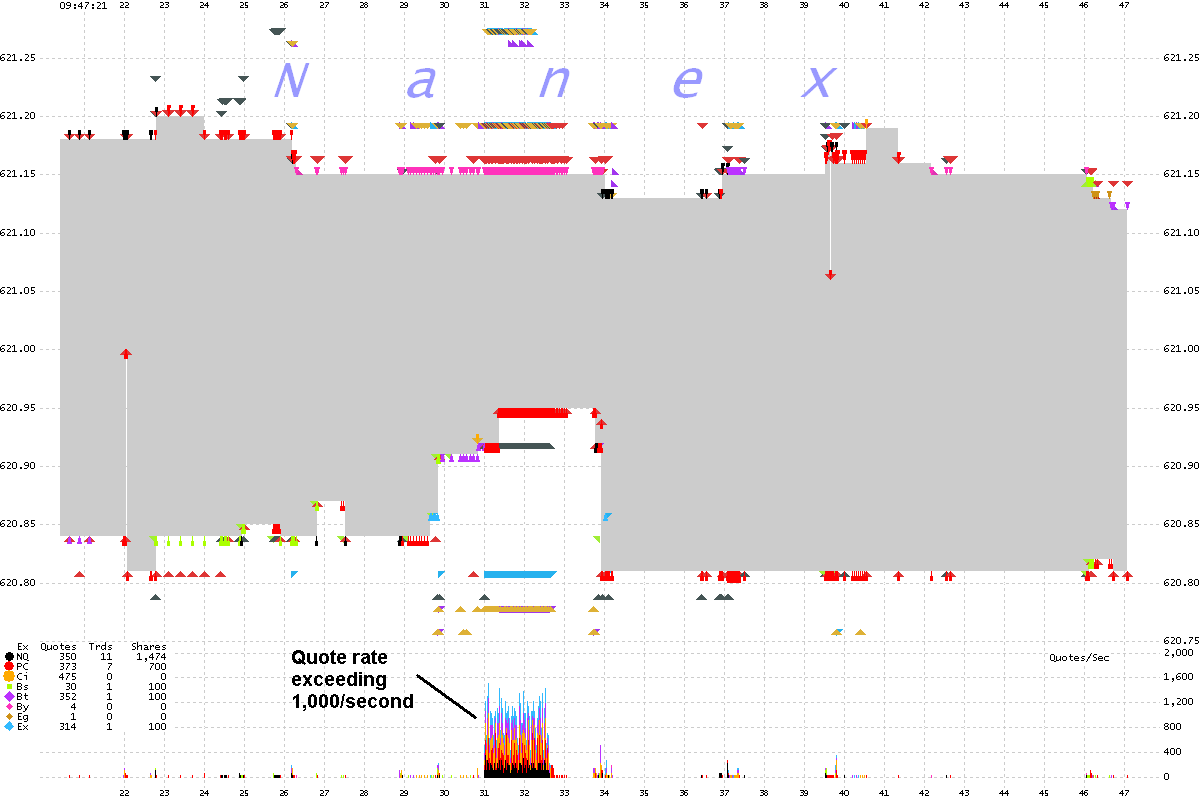
Zooming in with a 25 millisecond resolution chart (26 seconds of trading).

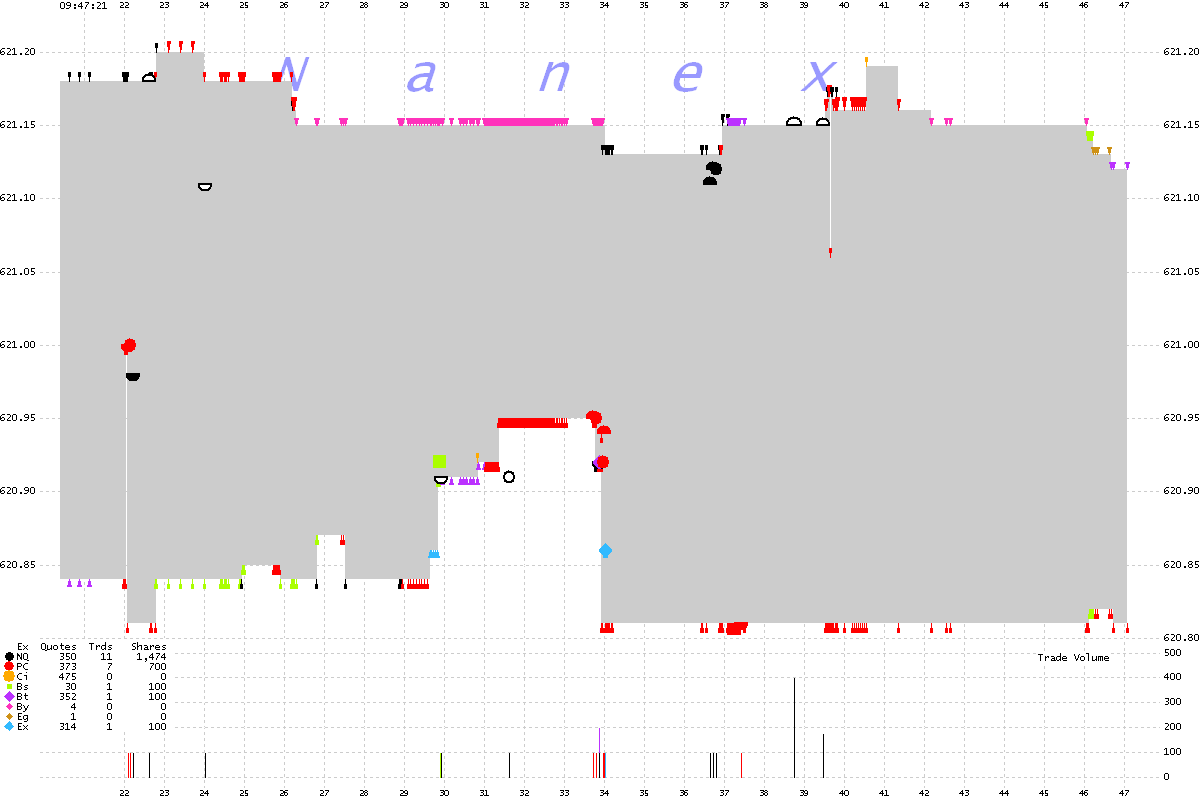
Same chart at above, but includes trades color coded by exchange.
The high quotes shown in the chart above don't seem to have any economic
relationship with trade executions in Google (shown in the chart below). We find they
never do when the intention behind the high quote rate is something other than executing
trades in the same stock.


