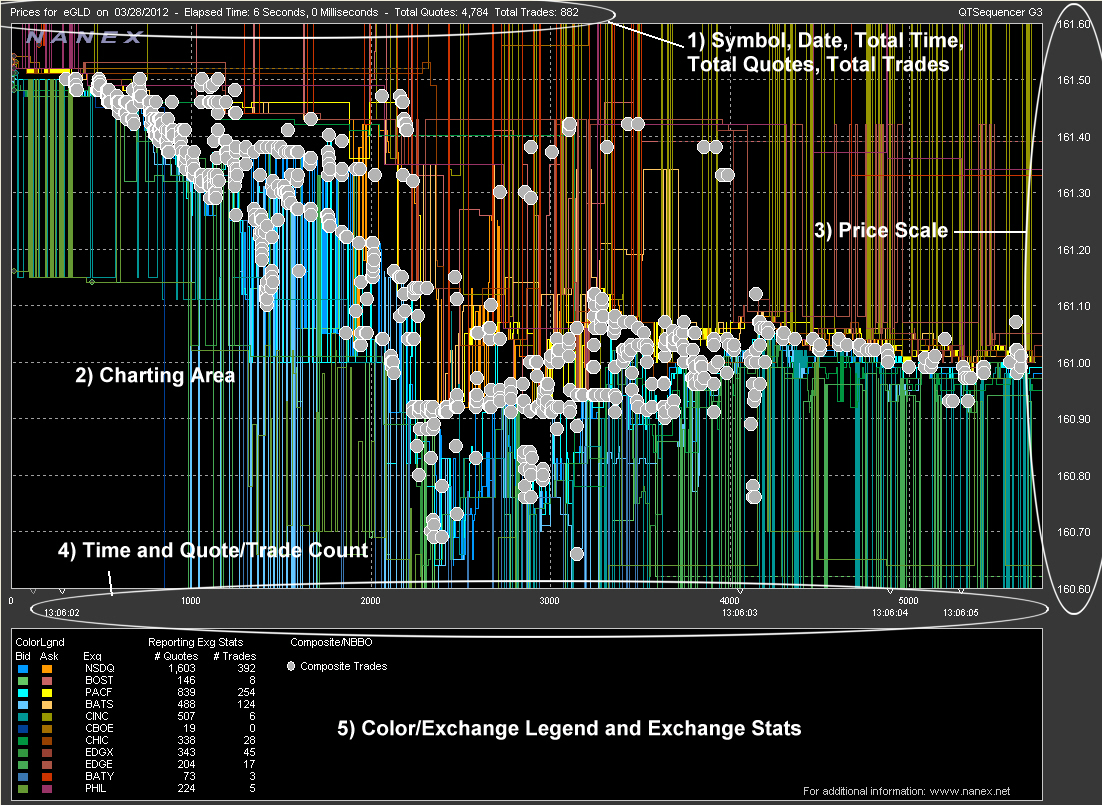
Note: Because Nanex has developed several charting systems to analyze market behavior, please be sure the chart you are referencing is labelled 'QTSequencer' in the upper right corner:
If it is not you may be looking at another Nanex chart type.
The main elements the chart contains include:
- Symbol, Date, Total Elapsed Time, Total Quote Count and Total Trades.
- Main charting area were prices are plotted.
- Price scale for prices plotted.
- Time and quote/trade count.
- Element legend including color legend and inidividual exchange stats.

In some charts quote and trade sizes may also be plotted with the price, as in the following example:
