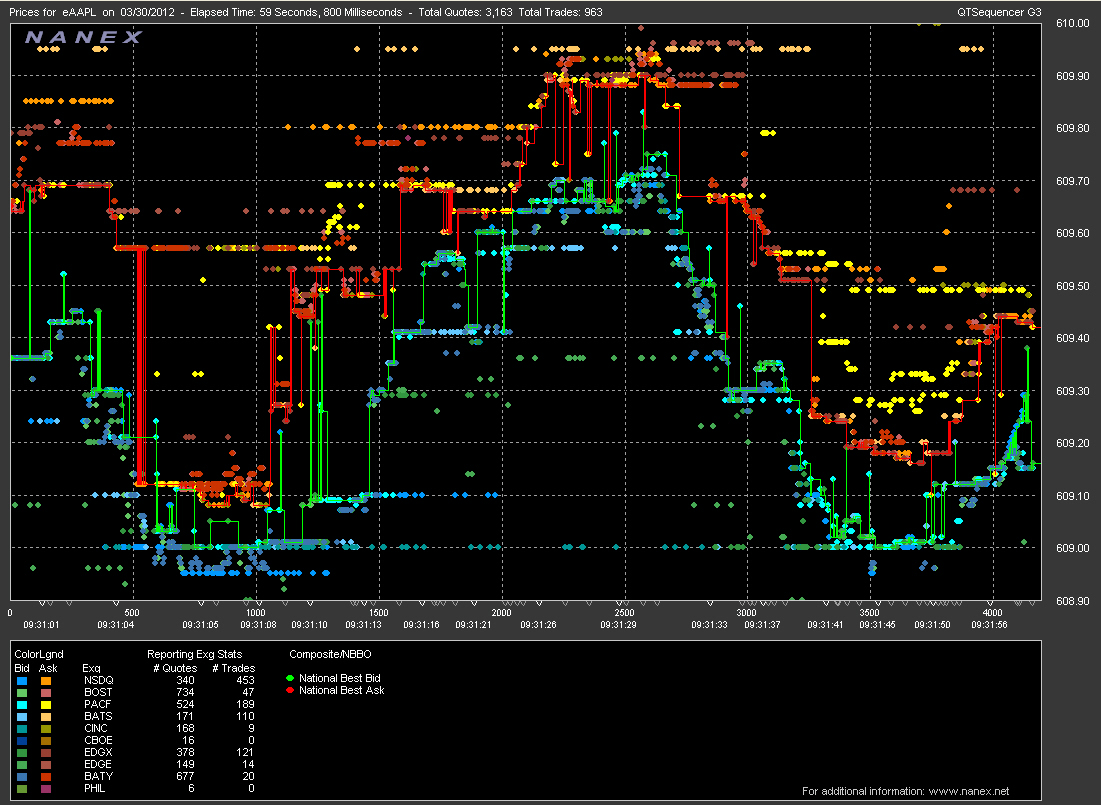
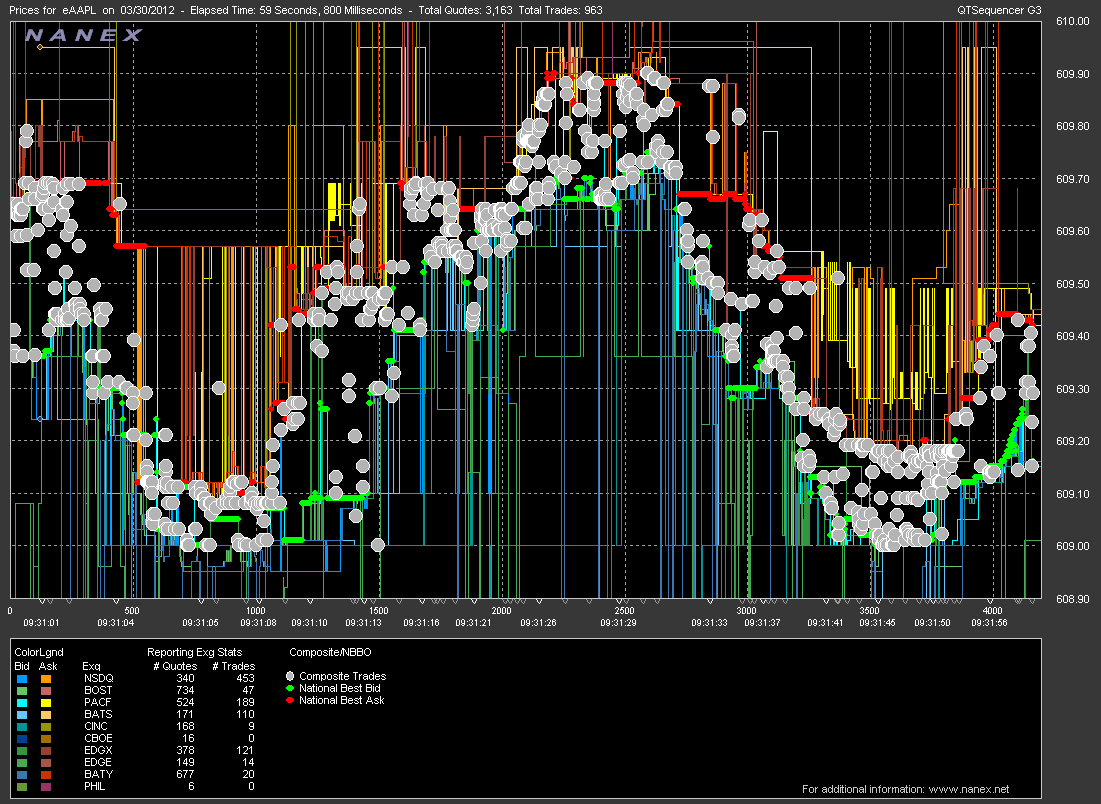
The following shows a typical chart of both trades and quotes plotted on the display:
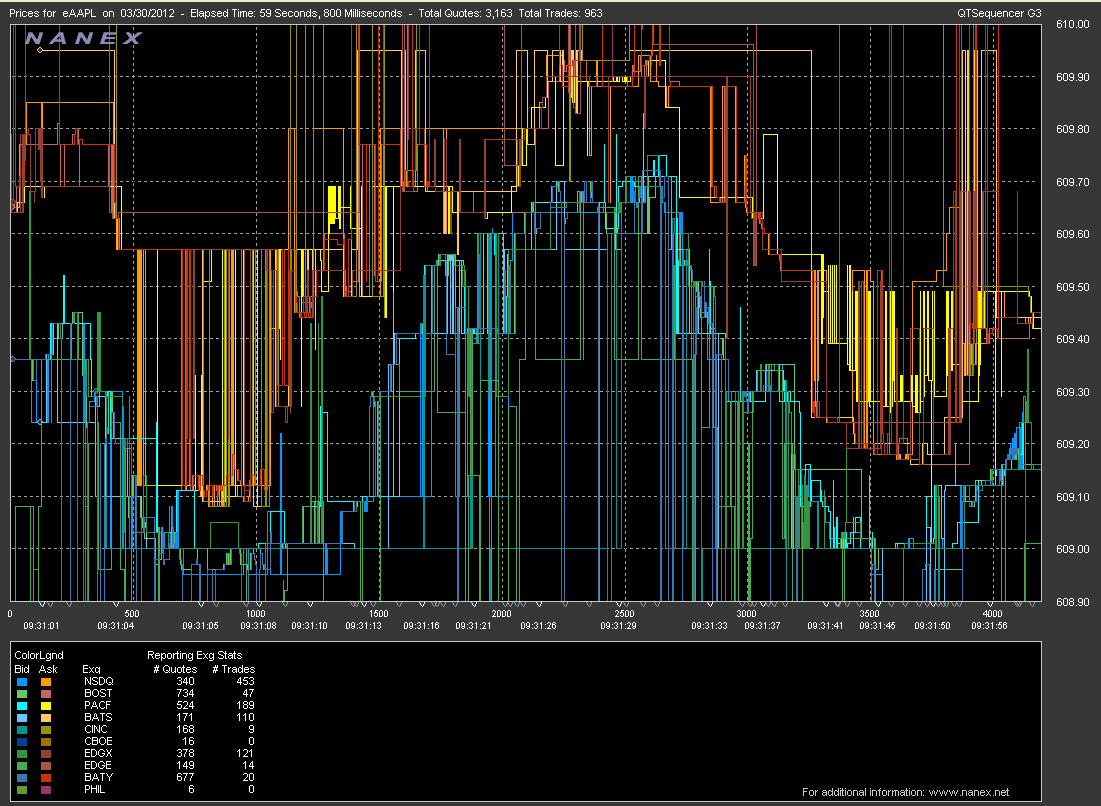
Removing the trades, only quotes are displayed. The quotes are colored according to the exchange color code in the lower legend of the chart:
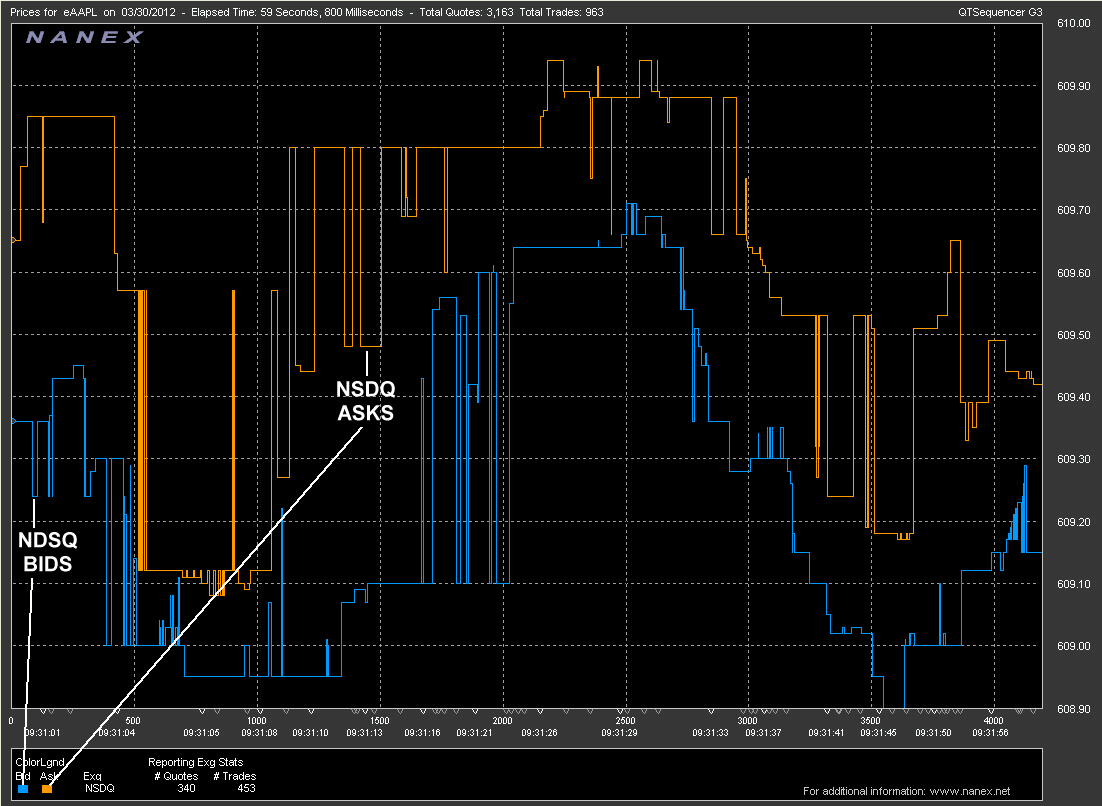
The following shows only quotes from the NSDQ exchange:
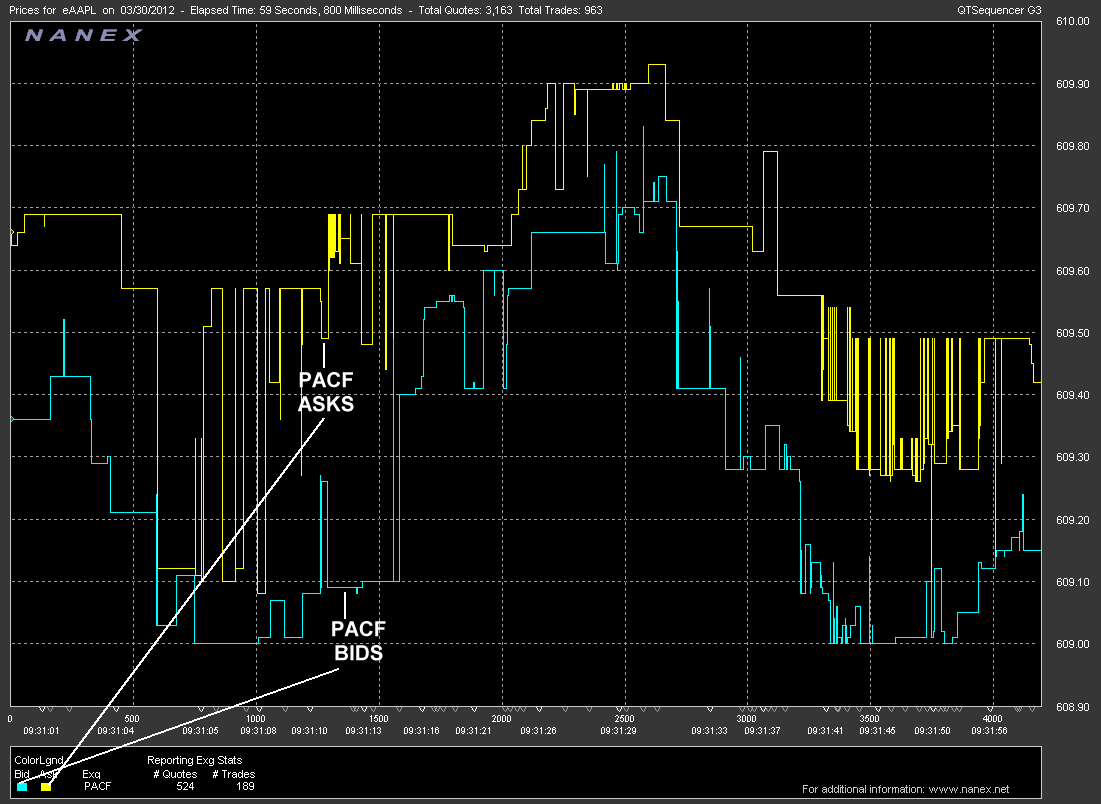
And in this chart, only quotes from the PACF exchange (NYSE Arca) are displayed:
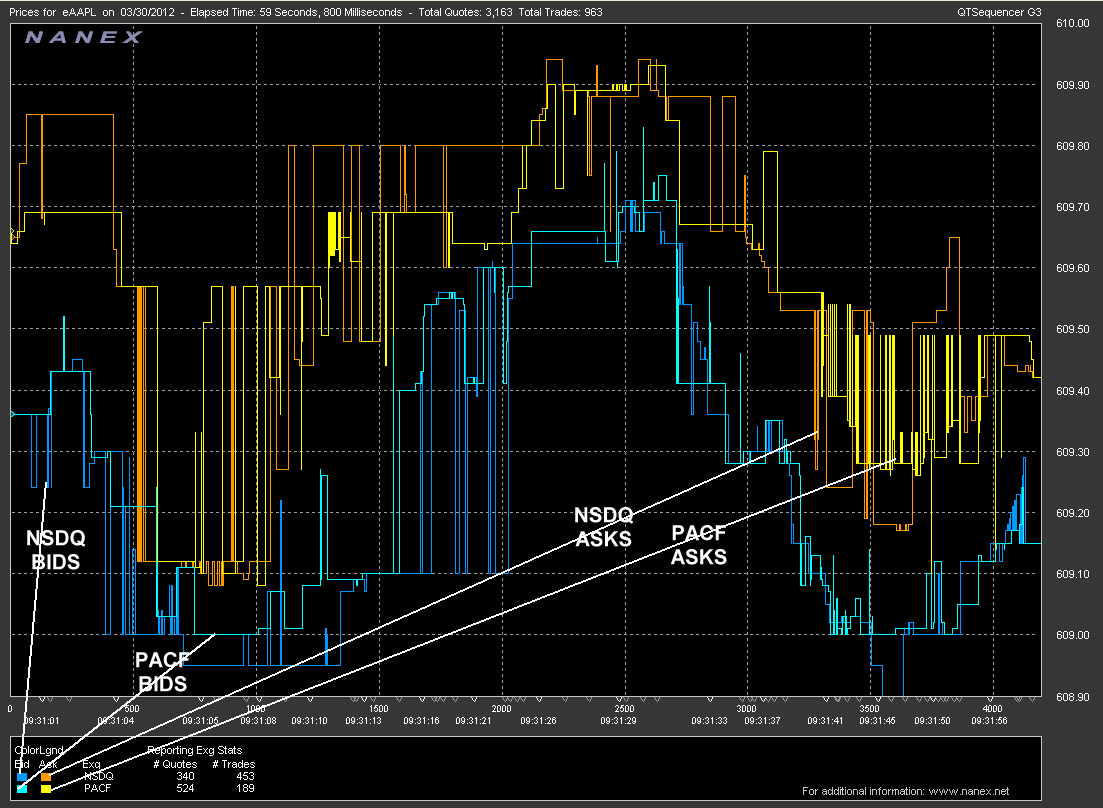
Combining quotes from both the NSDQ and PACF exchange:
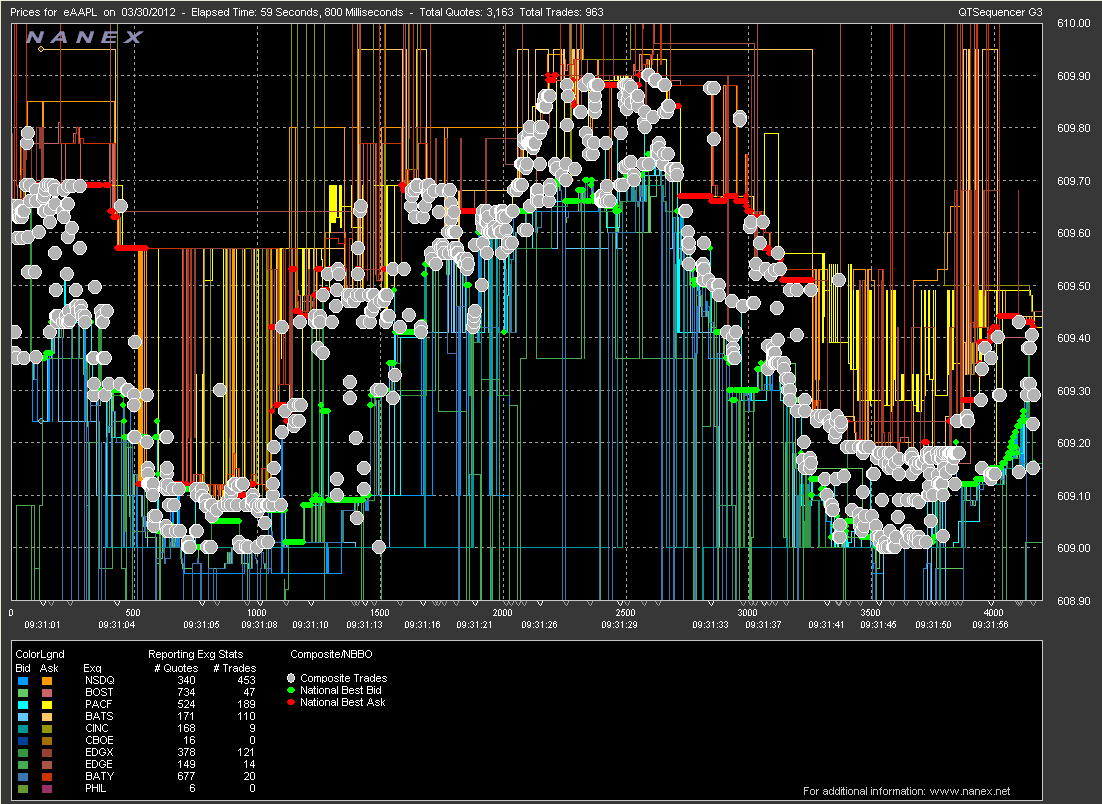
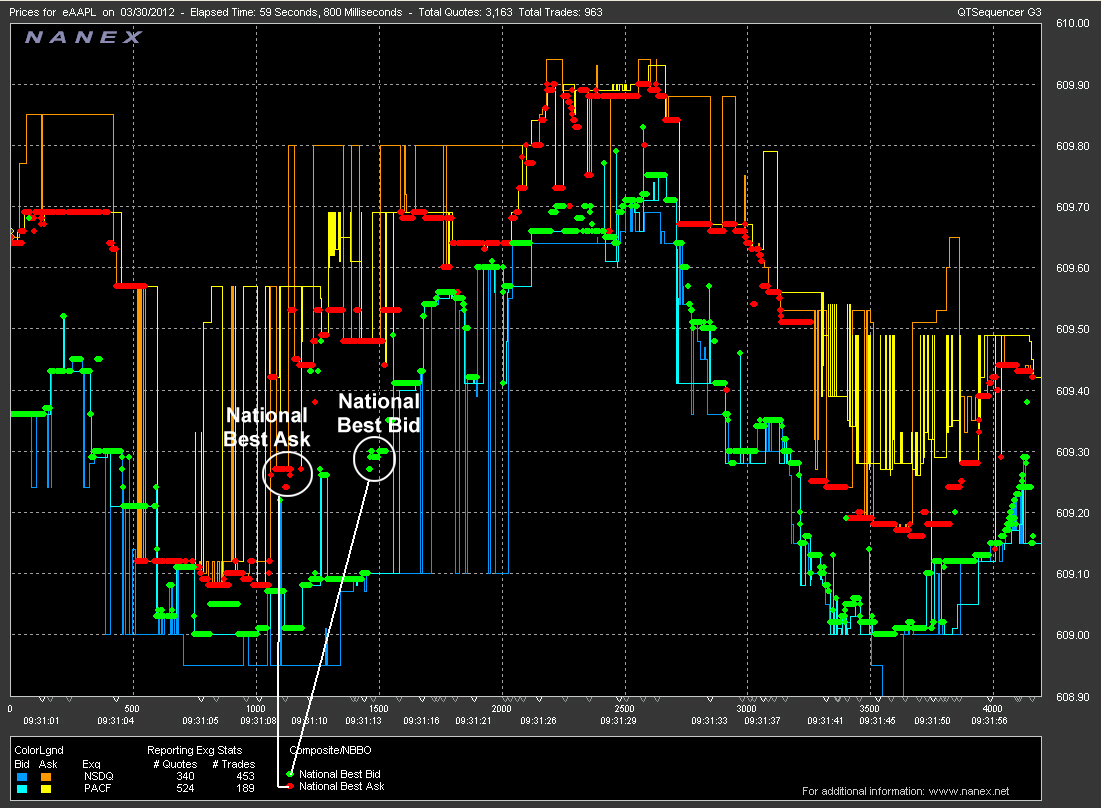
Adding in color coded dots that represent the National Best Bid and National Best Ask:
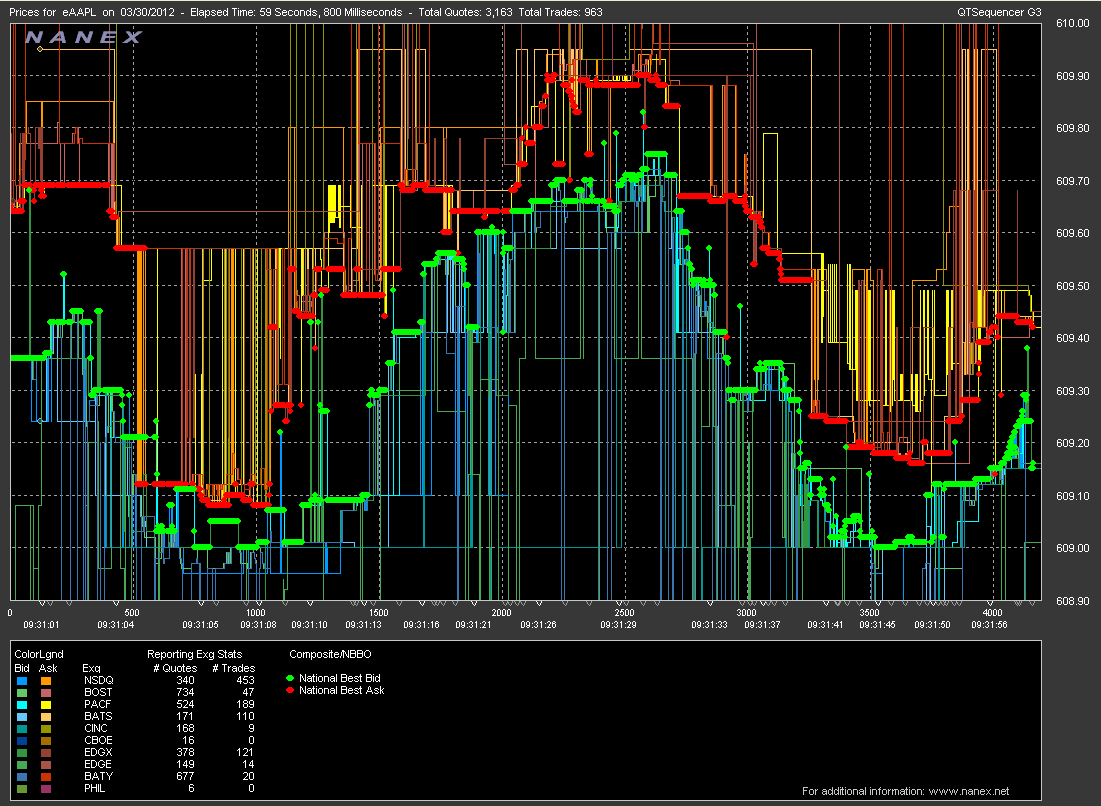
With all quoting exchanges and the NBBO:
Finally, plotting the trades over the quotes for a complete view:
Occasionally we may also chart quotes in a scatter-plot fashion, plotting each quote as a single point: