Nanex Research

Nanex ~ 20-Dec-2012 ~ Fiscal Cliff
On December 20, 2012, there was an Event in the EMini futures at 20:18:40 ET. The data
exhibits many hallmarks of a HFT (High Frequency Trader) market maker absorbing sell
orders up to their limit, and then turning around and dumping those contracts as fast
as possible. Exactly what happened in the Flash Crash on May 6, 2010 (this
documentary on youtube has a great explanation). Only in this case,
the original seller appears to be much more aggressive than Waddell & Reed's algorithm.
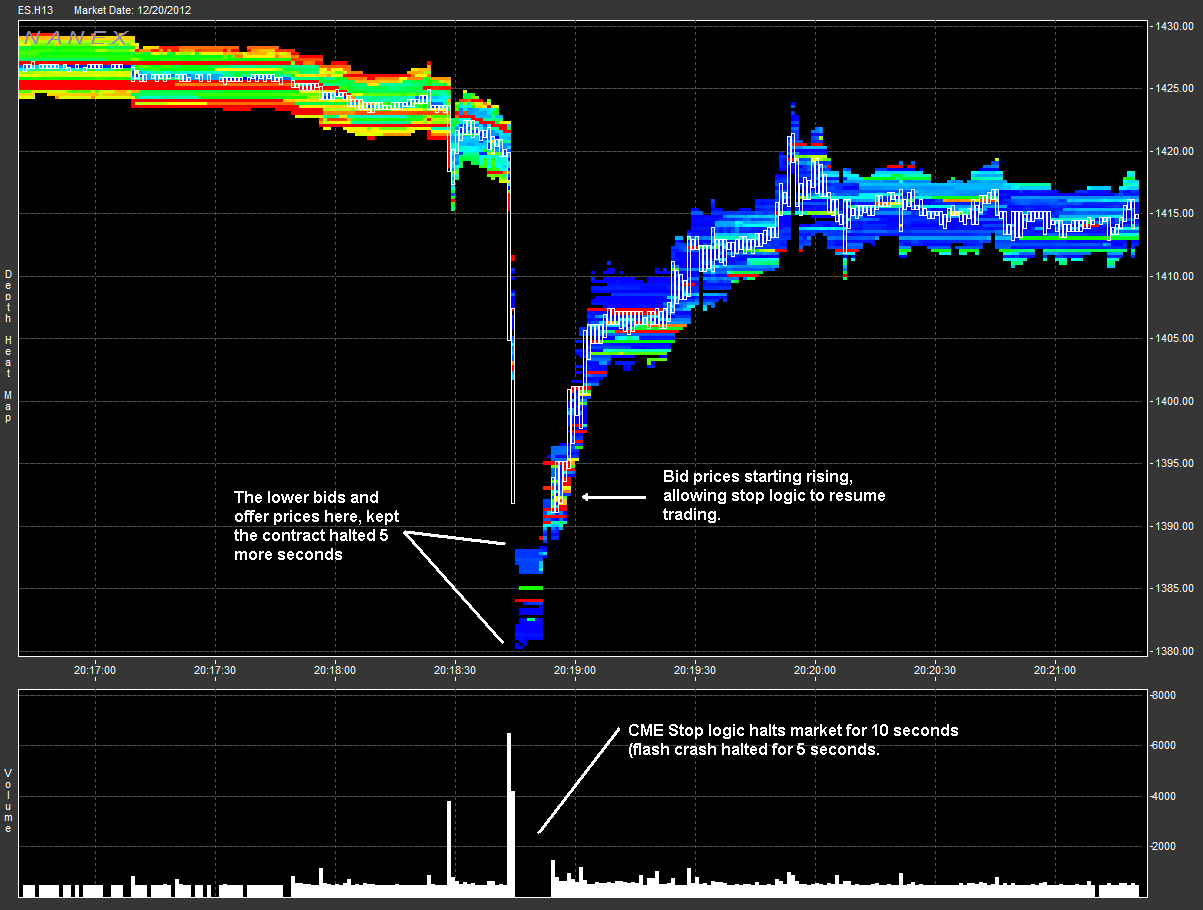
The drop came in 2 seconds, and halted trading for 10 seconds. The flash crash halted
eMini trading for just 5 seconds.
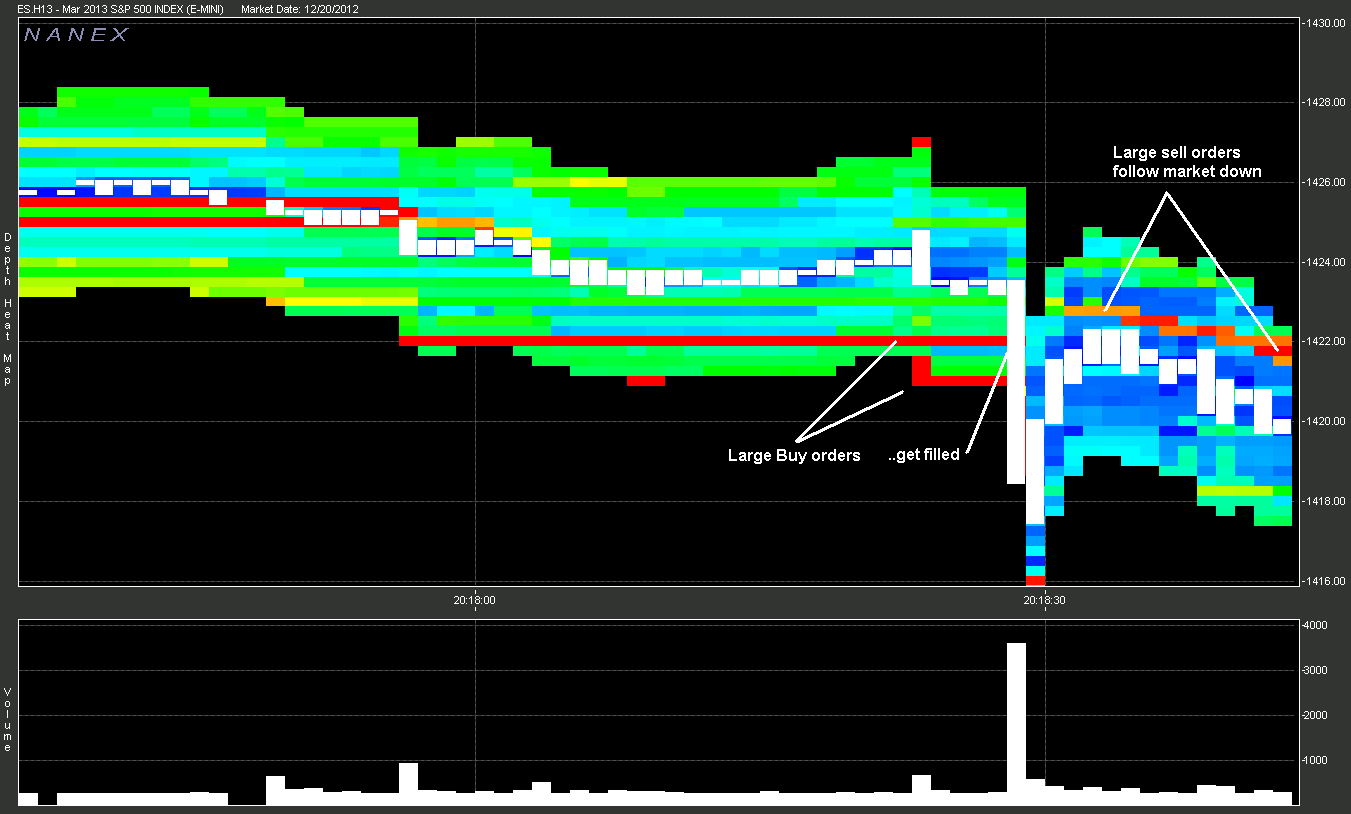
First 6 charts show our depth maps of the ES.H13 (March 2013 S&P 500) Futures Contract.
1. Close-up of drop, illustrating the 10 second gap - when CME stop logic kicked
in. Note flash crash only halted for 5 seconds.
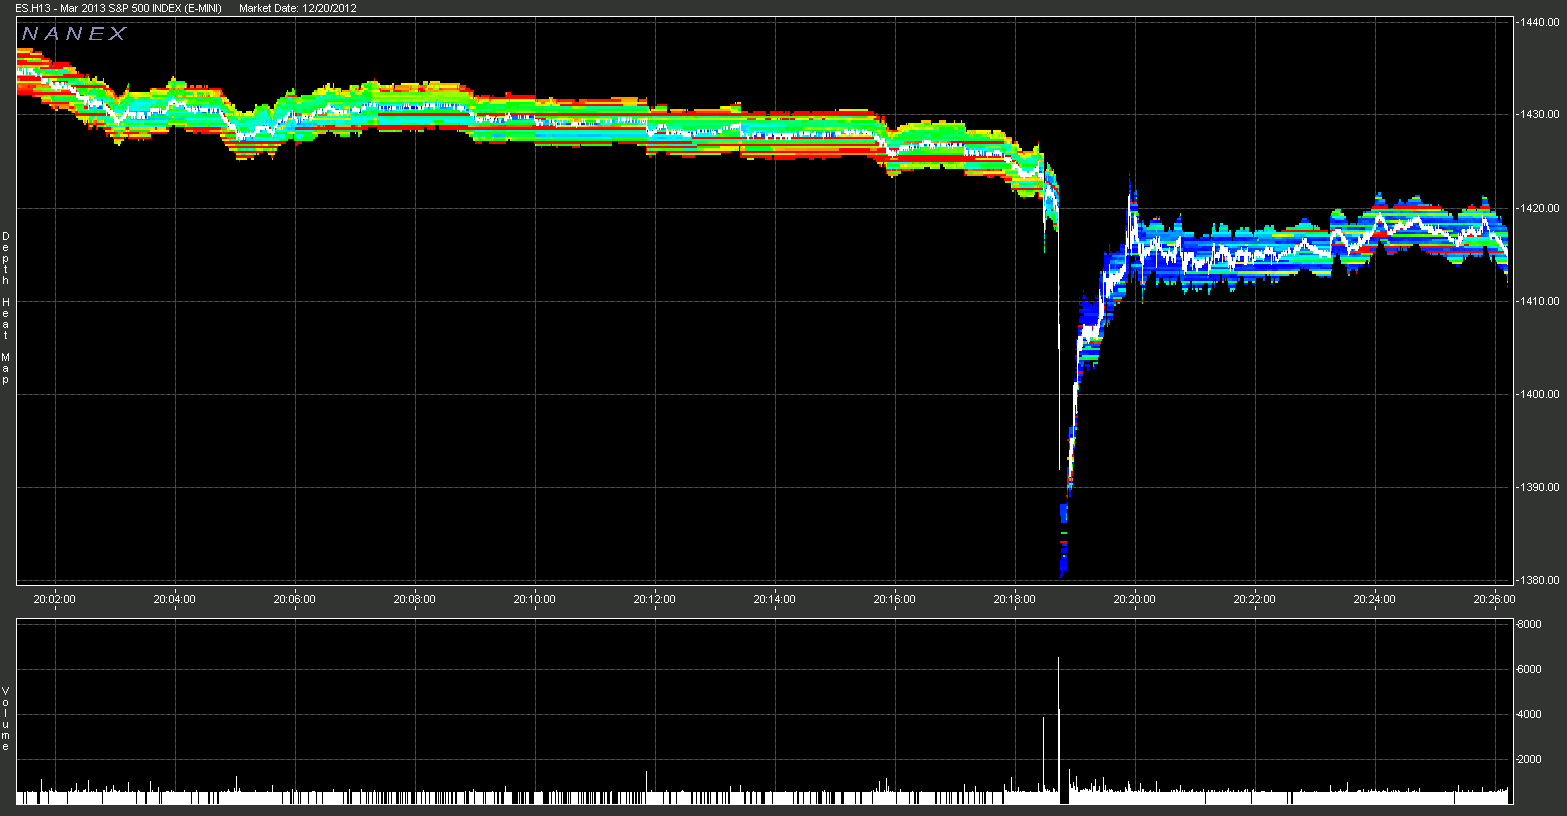
2. Overview, showing scale of the drop.
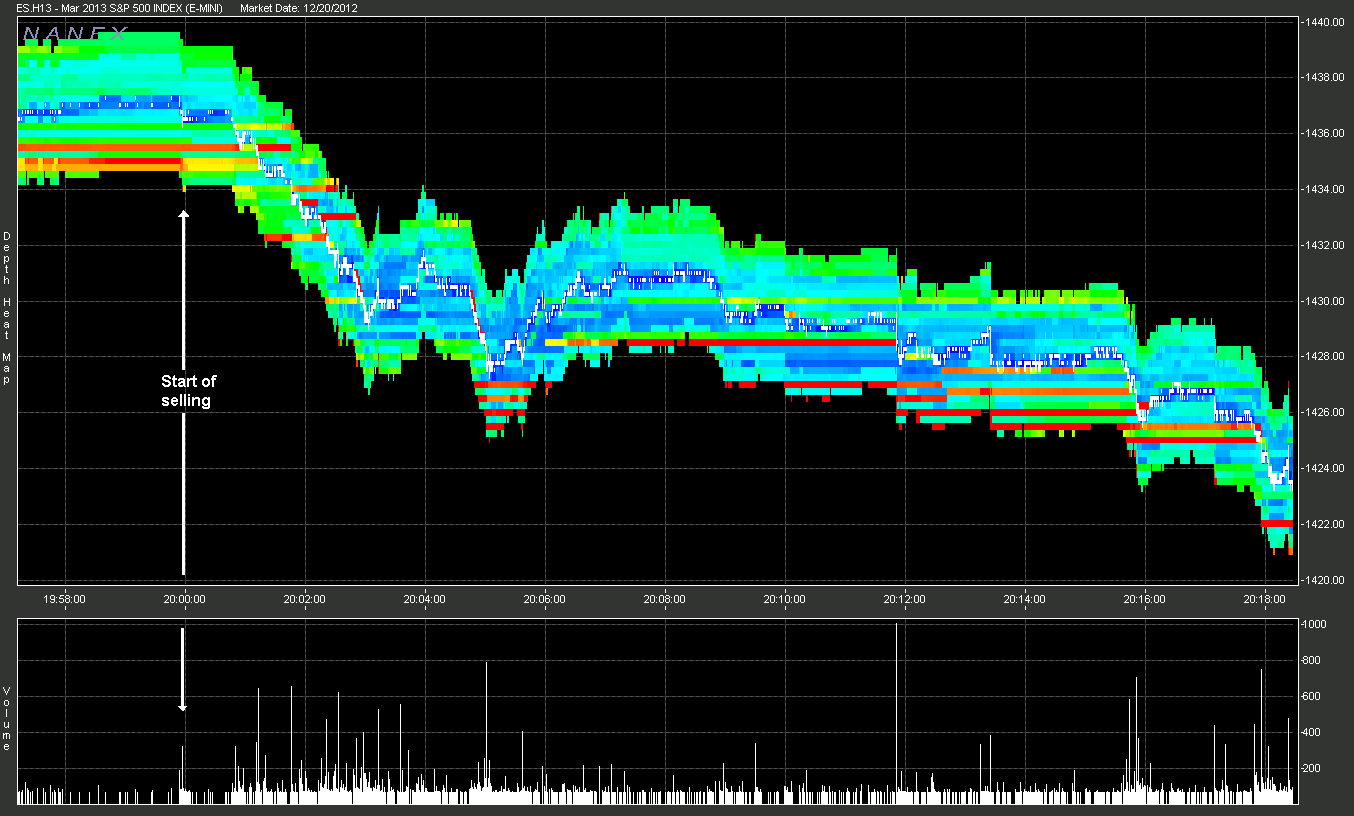
3. Large seller may have started at 20:00 (8pm) EST.
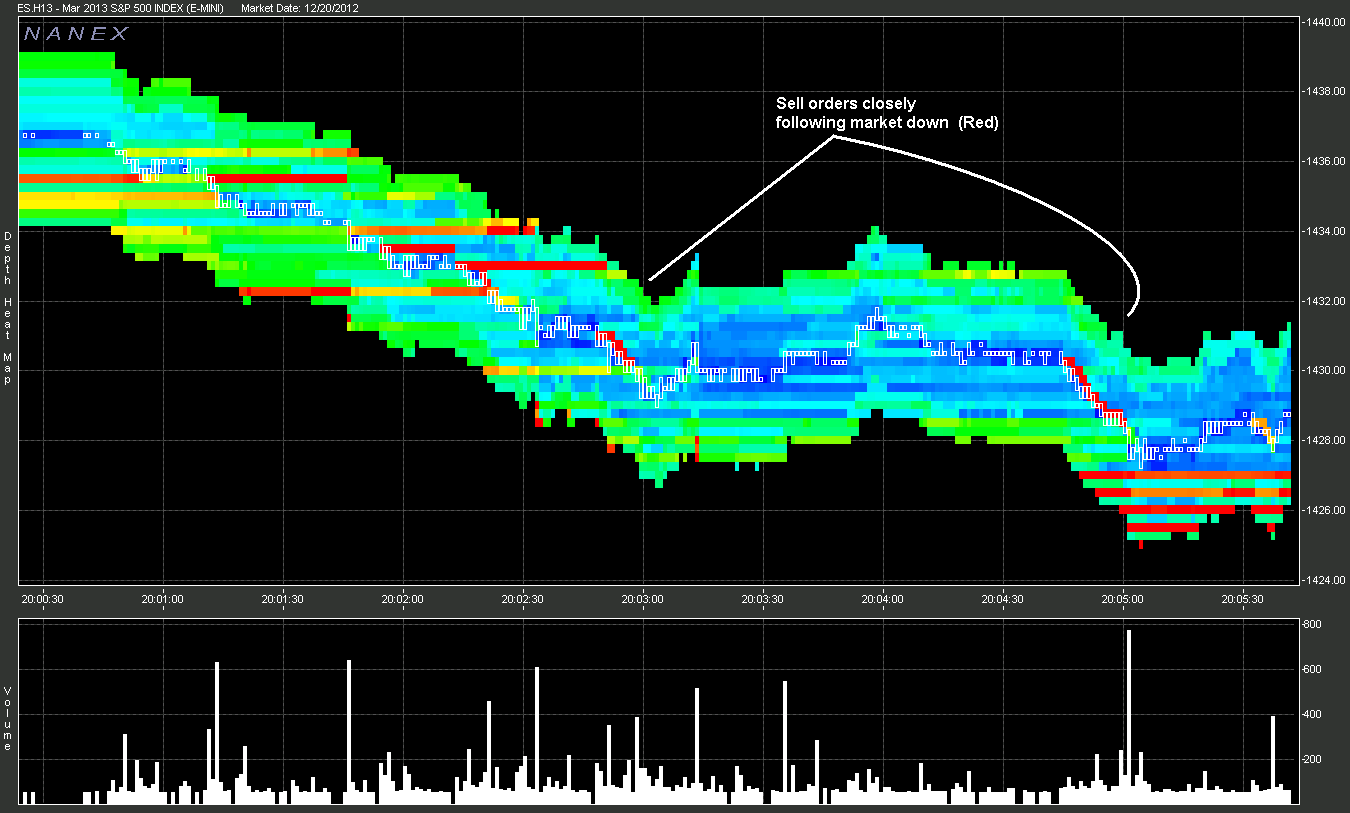
4. Large Sell orders chase market down.
5. Just before 1st big drop, large buy orders get filled, and immediately, large
sell orders appear.
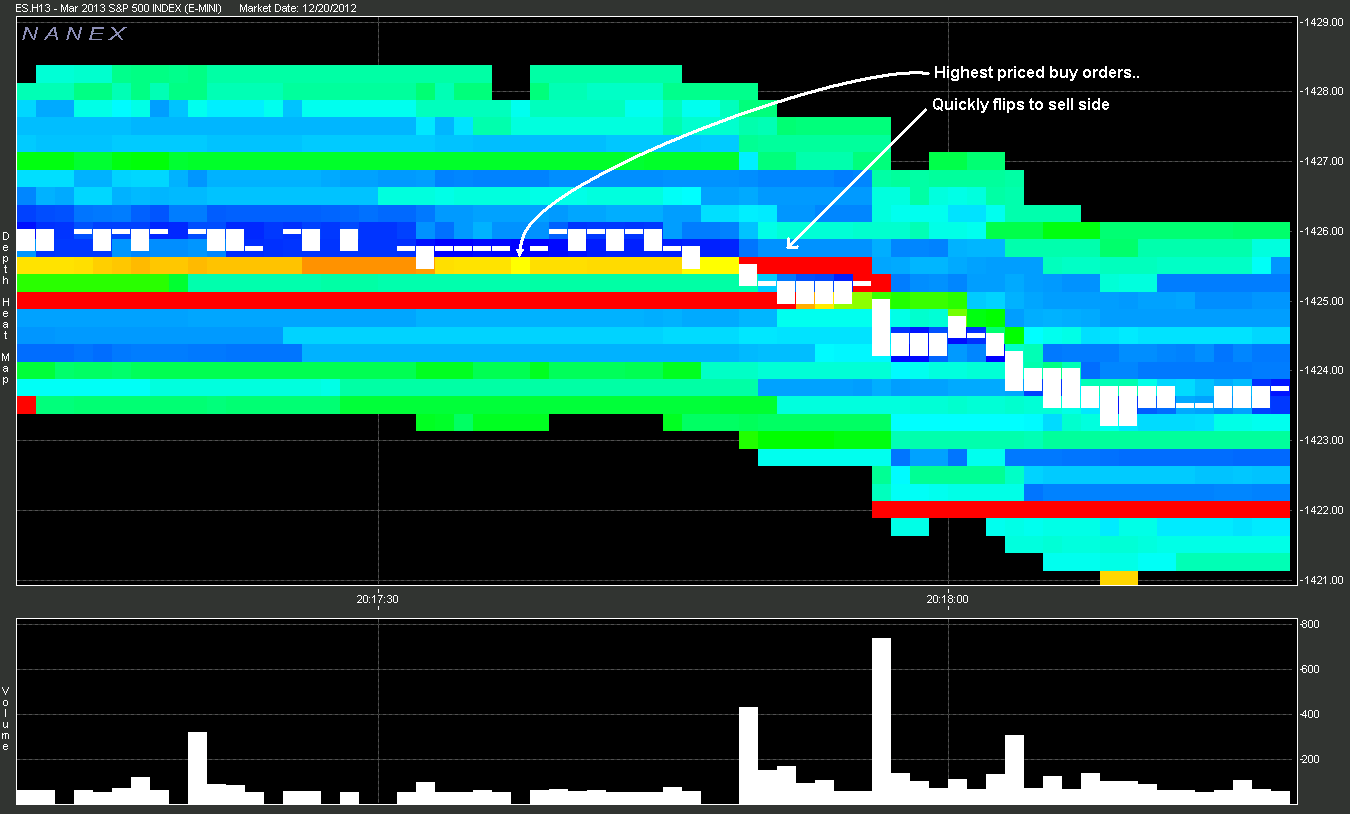
6. Continuation of Chart 5, more large buy orders filled, and large sell orders
start chaising market down.
7. Depth Map of ES.Z12 (December 2012 S&P 500) Futures Contract just before drop exhibits same trading patterns as the March 2013 contract.
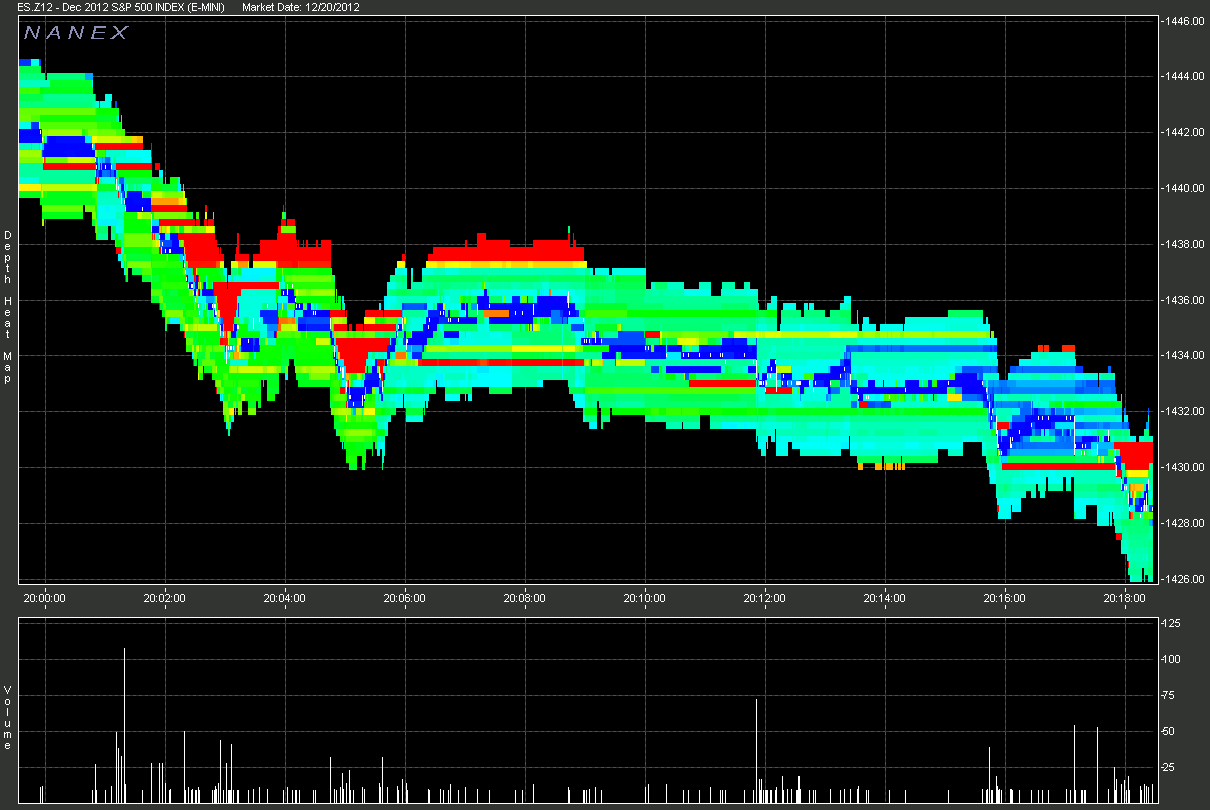
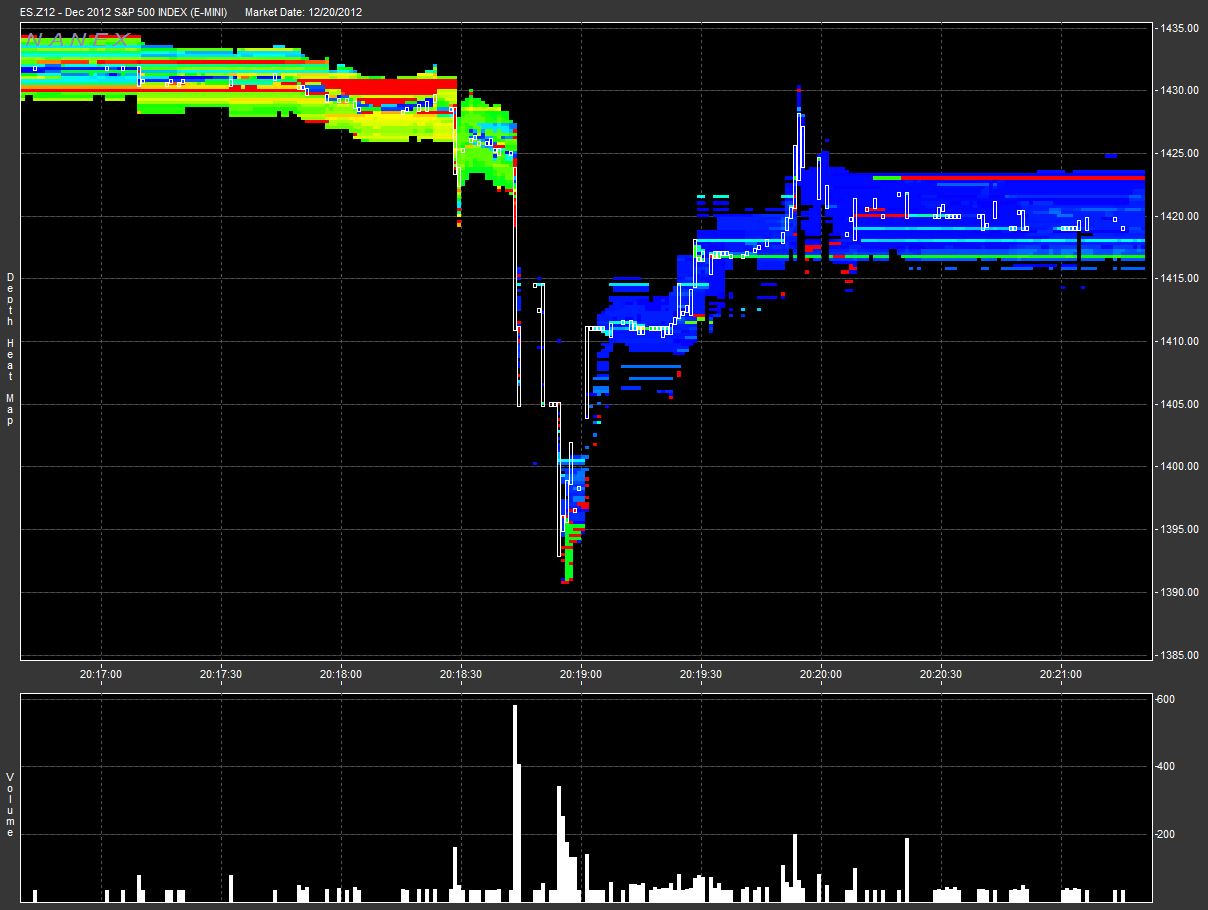
8. Depth Map of ES.Z12 (December 2012 S&P 500) Futures Contract. Trading
in this contract was not halted.
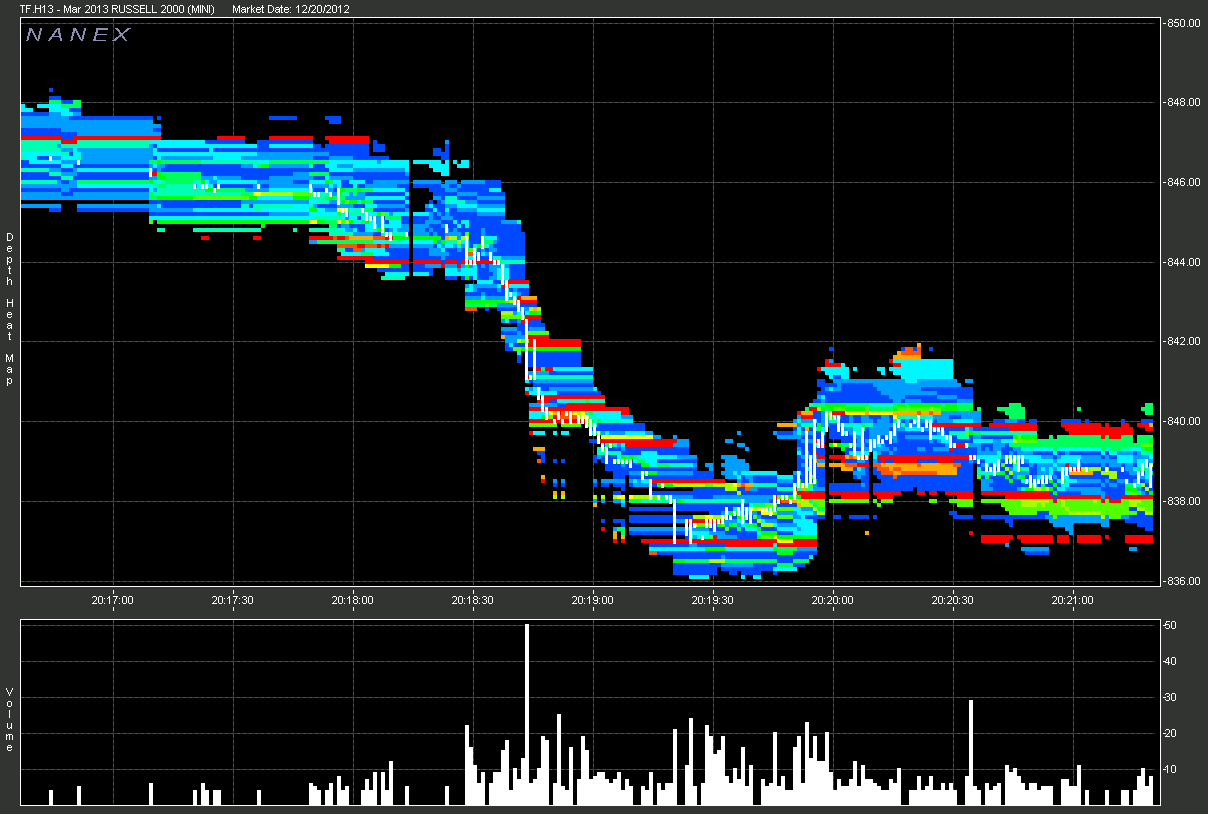
9. Depth Map of TF.H13 (March 2013 Russell 2000) Futures contract. Trading
in this contract was not halted.
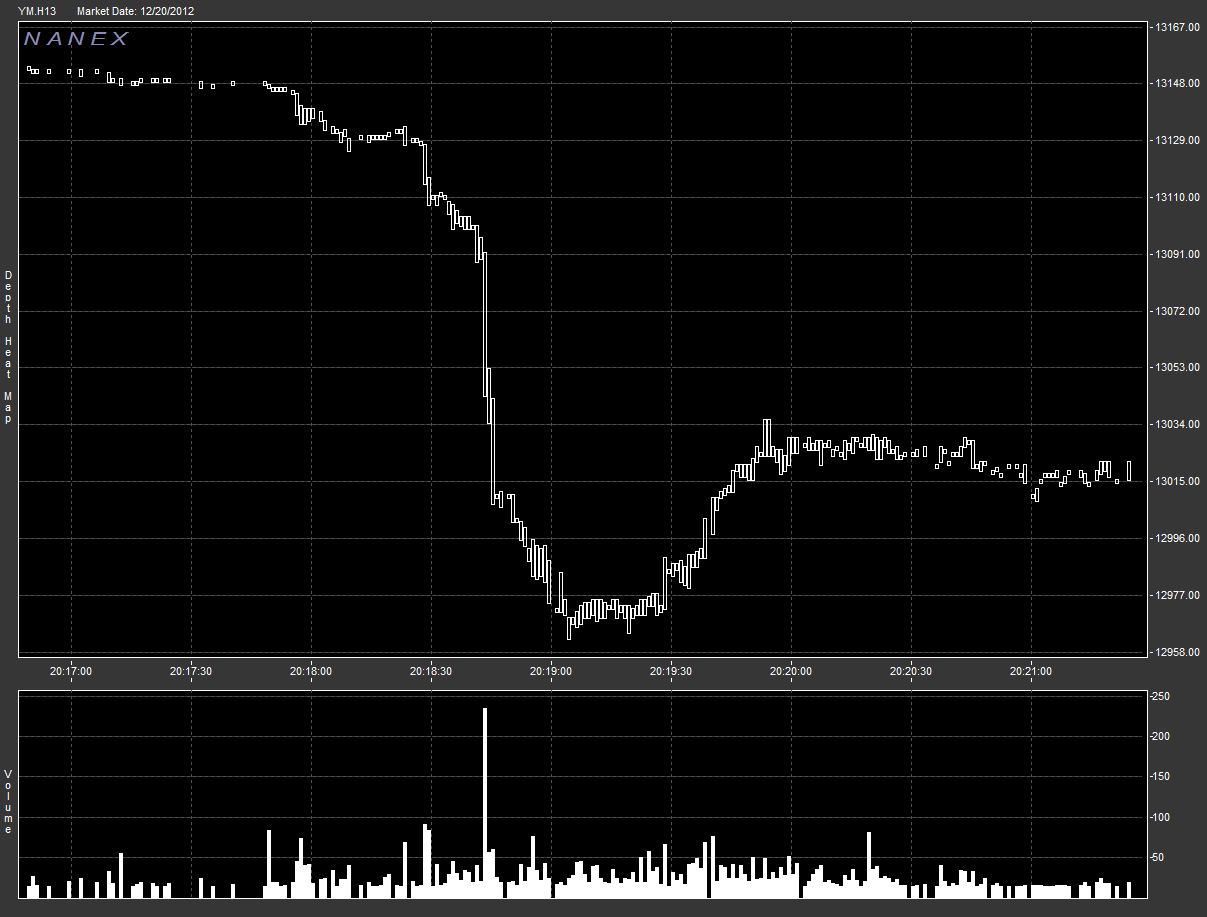
10. YM.H13 (March 2013 Dow Jones $5 E-MINI) Futures Contract from 20:17:00-20:21:30
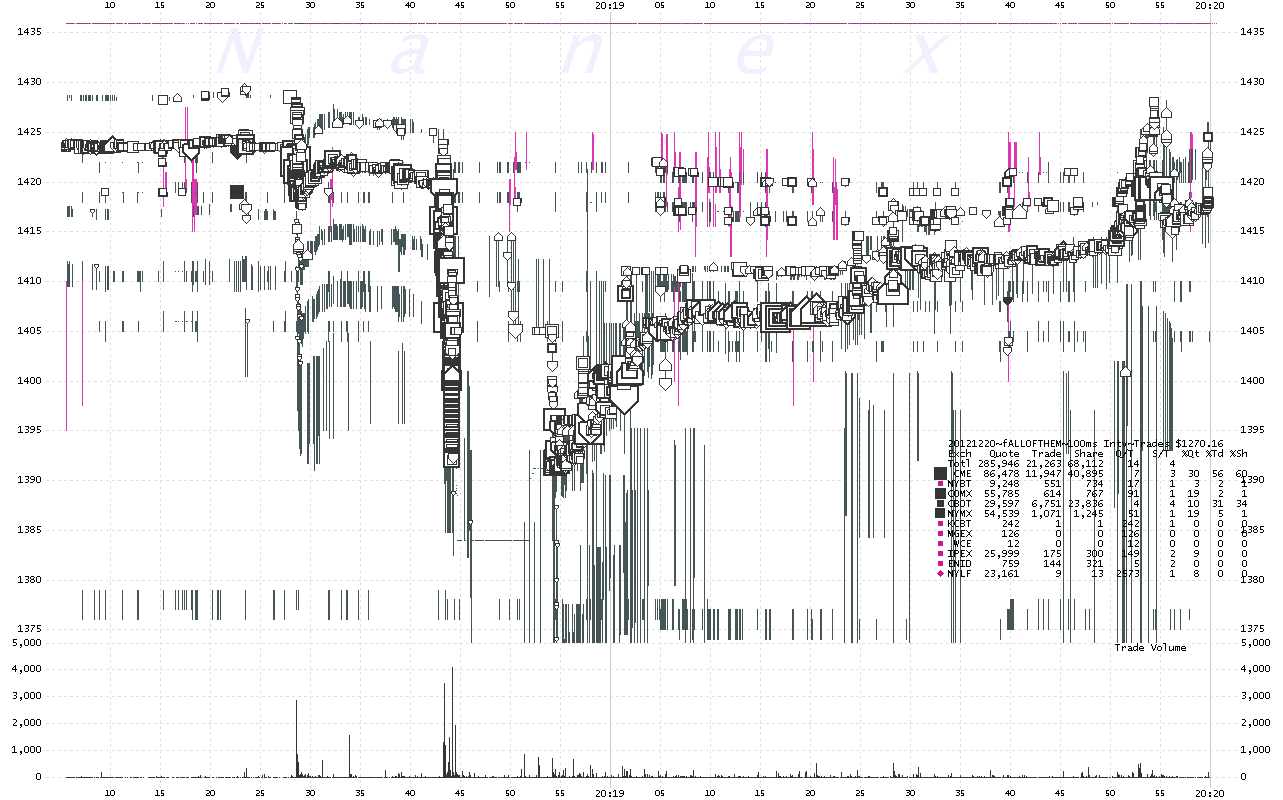
11. 100ms Resolution of All futures from 20:18:10-20:20:00 ET
Nanex Research
Inquiries: pr@nanex.net


