Nanex Research

Nanex ~ 30-May-2012 ~ Nasdaq, Facebook, and Order Routing
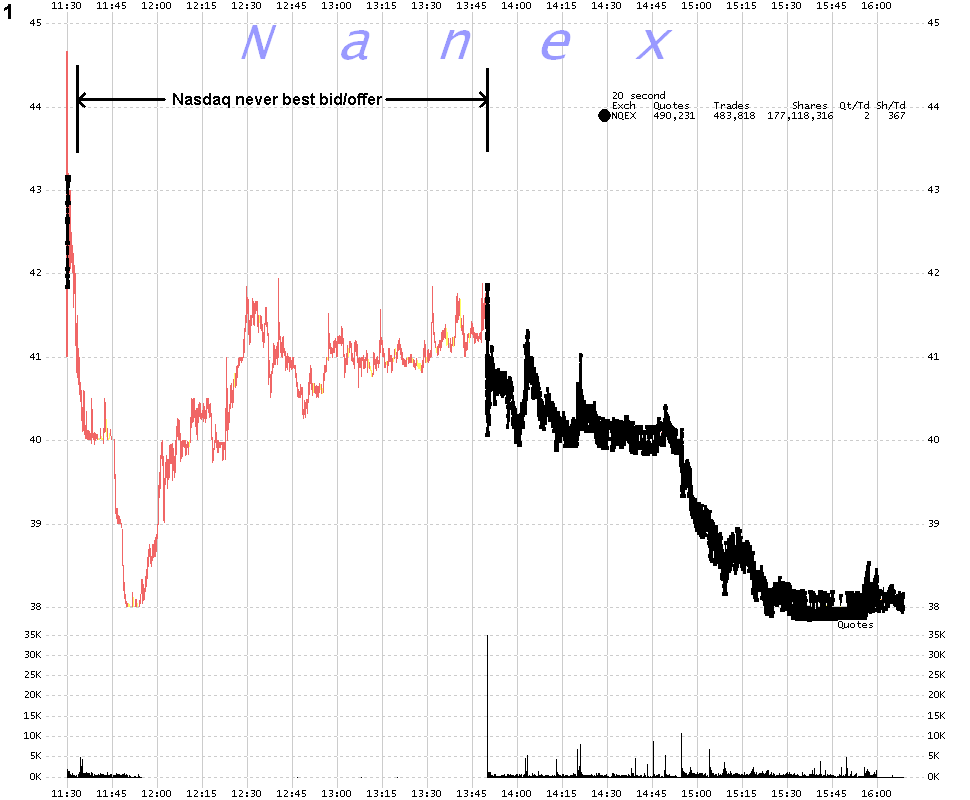
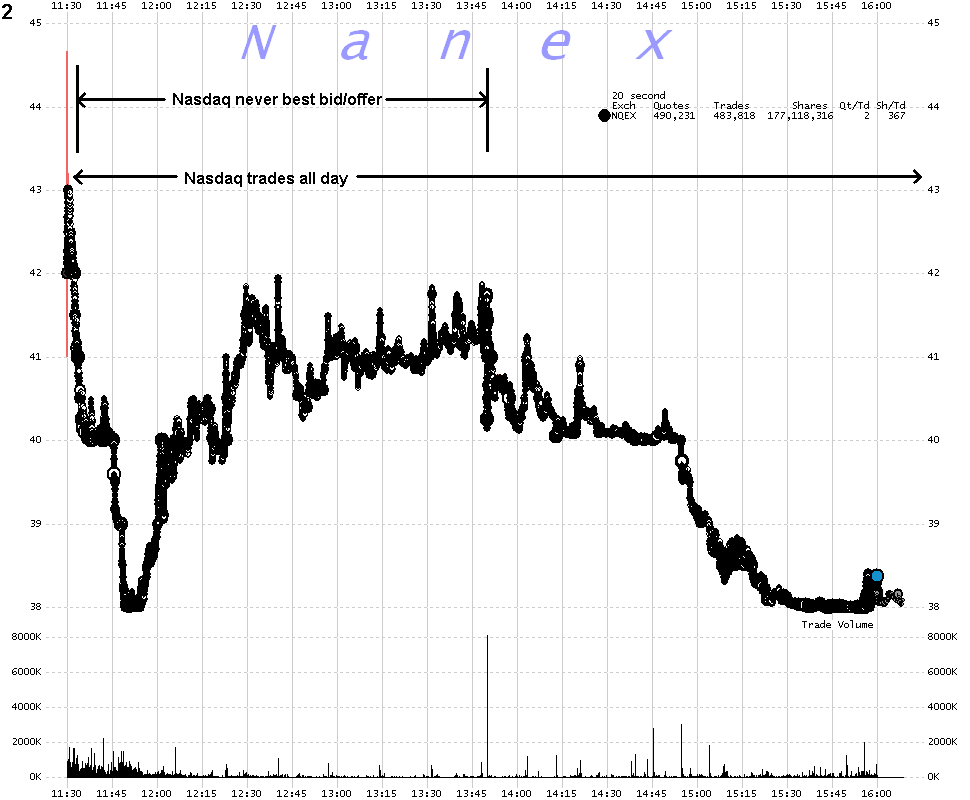
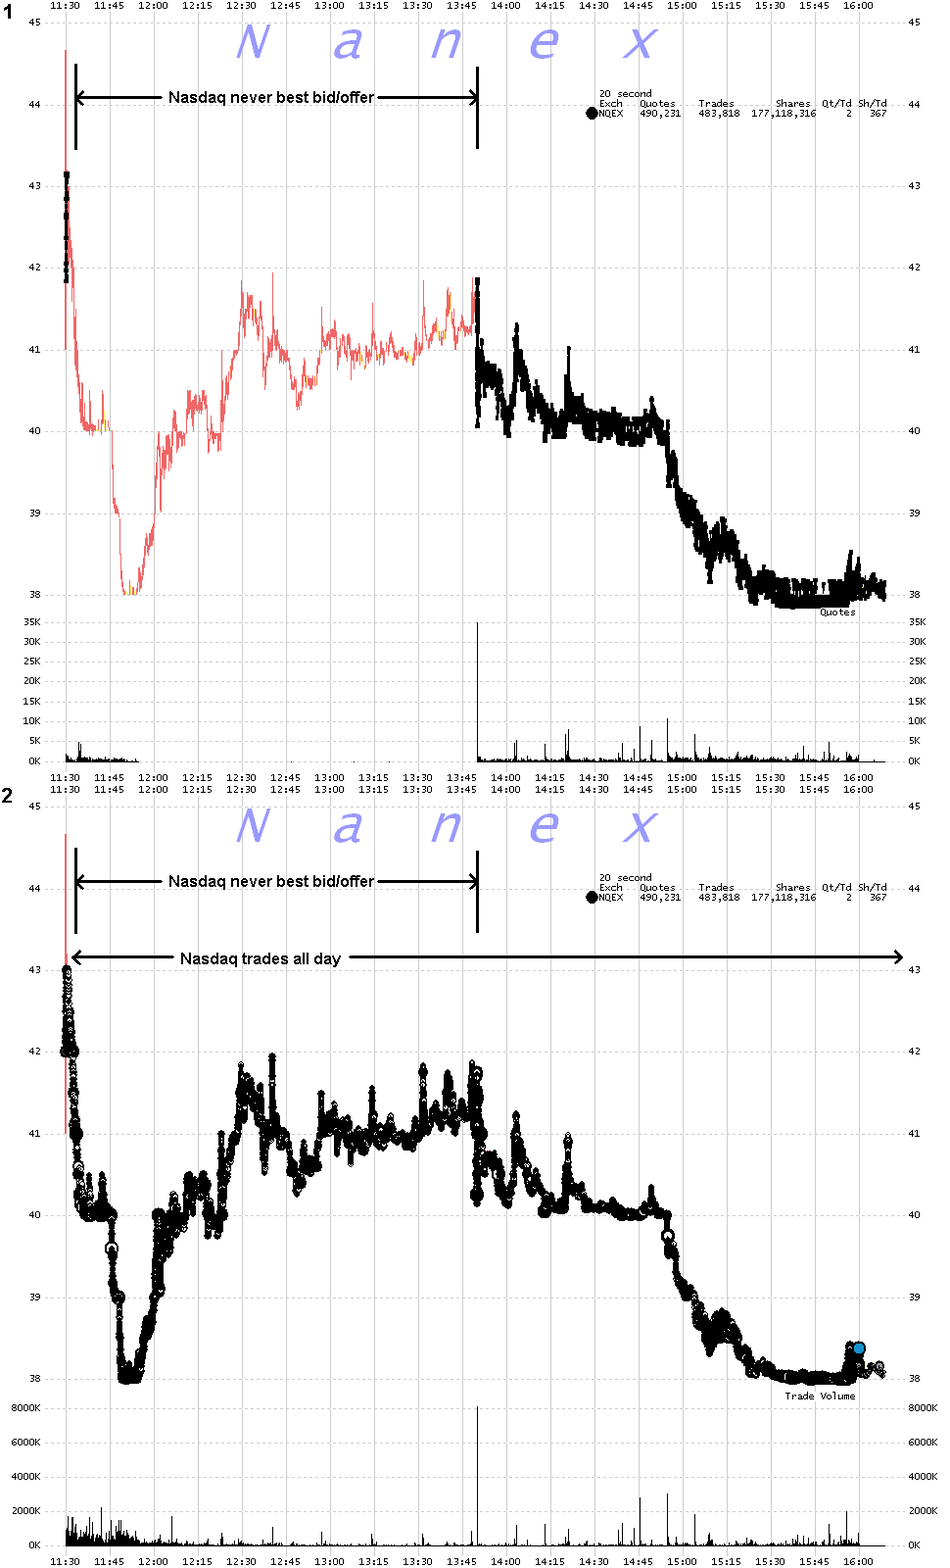
We would like an explanation for the animated chart below. How can trading at Nasdaq
not be affected, when our
Regulation NMS requires that orders must be routed to the exchange
at the National Best Bid or Offer (NBBO). Nasdaq was not the NBBO for over 2 hours.
How could a broker prove that a customer received the best price when the only available
(and official) audit trail (UQDF) doesn't include Nasdaq quotes for over 2 hours? More
on Facebook IPO anomalies.
Update ~ 31-May-2012 ~ Here is one answer we received.
From the Securities Technology Monitor article
Facing Up to a Real Time Trail:
At the very least, investors (and the SEC) might like to ask the Nasdaq
for a peek at its Market Replay Pro tool
that it developed to "validate best execution and Reg NMS compliance." That shows the
"state of the NBBO ... at any point in time.''
But Market Replay Pro only shows the state of the NBBO from Nasdaq's point of view.
You also need to see the state of the NBBO from the point of view of NYSE-Arca, BATS, BATS-Y, EDGE, EDGE-X
and the other 5 exchanges quoting in Facebook that day. And then to verify data from
each exchange view, you'd need to synchonize them in time.
Which is impossible, because
the speed of trading is much faster than the granularity of reliable timestamps. There
is a very good reason why Reg NMS mandated the use of a central SIP (Securities Information
Processor) as the official reference for the National Best Bid or Offer rather than
leave it up to each exchange individually to implement something like Nasdaq's Market Replay Pro.
The mere existence of this tool is
the equivalent of a large neon sign proclaiming that Reg NMS, when it comes to the
average investor, is no longer followed, and therefore, fundamentally broken.
In order to ensure that investors receive the best prices in Facebook (or any other
stock), every order, when presented to an exchange, must be routed to another exchange
if that other exchange has a better price. This is known as trade through price protection.
Reg NMS set up the use of a SIP that would receive prices from each participating exchange
and then display the best bid or offer for a stock in realtime.
This is not an easy concept to grasp - even some at the SEC do not fully understand
it, which is why we created a simulation program to help illustrate market routing.
You can view a video we captured from this simulation tool
here, and a more simplified view
here. The SIP in these videos is the white box at the bottom.
You can also download
(bottom of page) this simulation tool (free).
By using a centralized SIP, Reg NMS made it possible for everyone, from traders to investors,
to receive the National Best Bid or Offer from a single consolidated data feed (the
SIP), rather
than have to subscribe to every single exchange and aggregate the information themselves. And lots of people rely on the data from the SIP. Internalizers use prices from the SIP when internally matching customer orders. Brokers
use prices from the SIP when filling out their quarterly reports of trade execution
quality. And millions of subscribers pay exchange fees to receive and view data from
the SIP.
But not High Frequency Traders (HFT). They use direct feeds, which Reg NMS allows -
with
the following condition: a direct feed may not receive core information (time, price,
size) faster than it is sent to the SIP. Furthermore, exchanges are required to route
orders based on the National Best Bid or Offer, which is defined in Reg NMS as the display
price from the SIP, and not the price from the direct feed. Nasdaq itself makes this routing requirement clear in a
recent rule change proposal.
So when there is an exchange
breakdown or problem, it allows us to see what is going on behind the
curtain, so to speak. The feed breakdown in Facebook tells us that the 10 other exchanges
could not have been using Nasdaq's quote from the SIP when making order routing decisions.
They had to be relying on direct feeds. Which is fine if speed is the only concern,
and regulations are merely guidelines.
If the concern includes auditing and fair play, well, you many need to adjust your expectations
accordingly.
Chart 1
Black dots show where Nasdaq was Best Bid or Offer (NBBO). Red/yellow shading
is the NBBO spread that shows through when another exchange was NBBO.

Chart 2
Black dots show where Nasdaq trades executed (all day).

Animation of Charts 1 and 2, showing (1) where Nasdaq was National Best Bid or Offer and (2) where Nasdaq trades occurred.

Nanex Research


